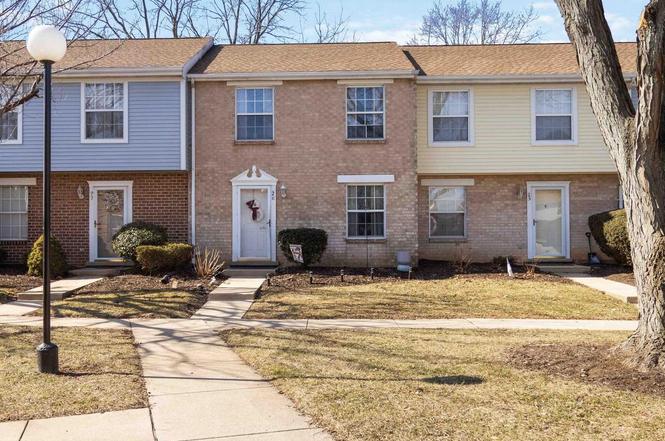
26 Williamstown Cir #26 · York, PA
Flood risk 4/10 · Minor
- FEMA flood zone
- X (unshaded)
- Chance of flooding over 30 yrs
- 0.2%
- Est. flood insurance / yr
- $507 – $1,088
Fire risk 1/10 · Minimal
- Est. fire insurance / yr
- $511 – $949
Heat risk 5/10 · Moderate
- Hot days now (above 103°F)
- 7 days/yr
- Hot days in 30 yrs
- 15 days/yr
Wind risk 4/10 · Minor
- Chance of severe wind over 30 yrs
- 11.0%
Air-quality risk 3/10 · Minor
- Unhealthy air days now
- 3 days/yr
- Unhealthy air days in 30 yrs
- 5 days/yr
Risk factors via First Street. Map © Google.
Why this score? — see what drove the D+ grade
The composite is a weighted blend of 9 inputs, each scored 0–100. Each bar is that input's sub-score; the figure is the points it added to the 100-point composite (weight × sub-score).
- ARV discount +15.0/15.0
- Cash flow +10.1/30.0
- 1% rule +5.0/10.0
- Rent growth +4.1/5.0
- Schools +4.0/10.0
- Livability +3.8/5.0
- DSCR +2.9/10.0
- Condition / age +2.8/5.0
- Appreciation +0.0/10.0
$159,999
🖨 Deal sheet (PDF) 📄 Offer letter ✓ Due diligence
Listing remarks
This 2-bedroom, 1.5-bath townhouse offers a great opportunity to create a space that truly feels like home. The main level features a comfortable living area, a dedicated dining space, and a convenient half bath for guests. Upstairs, you’ll find two well-sized bedrooms and a full bath, with a layout designed for everyday functionality. Natural light adds warmth throughout the home, and the practical floor plan makes the most of the space. With room to personalize and update to your own style over time, this property provides a chance to build value while tailoring the home to your preferences. Low-maintenance living and a manageable footprint make it an appealing option for those look
Key facts
- $255 HOA
- 2 parking spots
- Built 1983
Property features AI
Finance
- HOA & community: HOA fee of $255 per month
Exterior
- Parking: Parking lot with 2 spaces (total 2 garage/parking spaces)
- Utilities: Public water; Public sewer; Electric service
- Home design: Interior townhouse/rowhouse; Above-grade finished area reported by assessor
- Construction: Vinyl siding; Aluminum siding; Slab foundation
- Exterior features: Not in a federal flood zone; Tidal water: no
Interior
- Bedrooms: 2 bedrooms on the upper level
- Bathrooms: 1 full bathroom on the upper level; 1 half bathroom on the main level
- Heating & cooling: Heat pump(s) heating; Central A/C (electric); Electric hot water
- Interior features: No basement; Living area reported by assessor
Neighborhood map
What this means for you Summary
Snapshot
- This is a 2-bed/1.5-bath townhouse listed at $160k. Condition is rated average.
Deal economics
- At list price, monthly cash flow is $-95 ($-1k/yr) — negative.
- To cash-flow at today's rent, offer at most $146k (8.6% below list).
- Meets the 1% rule at list price ($2k rent vs $160k).
- Recommended offer: $146k (8.6% below list) — sets the bar for cash-flow.
Location & tenants
- Location reads 75/100 on livability (#427 in PA, #3,987 nationally) — a middle-class / working-renter tenant base. Strengths: cost of living A+, health & safety A+, housing A; Watch: amenities D+, crime F, employment F.
- Central York SD (suburban): math 33% / reading 57% proficiency, ranked #244 of 539 in PA (top 45%) — families likely to look elsewhere, expect single-tenant / working-renter base with shorter leases.
- Zoned schools: Hayshire El Sch (math 17% / reading 32%, grade F, #1,180 of 1,518 statewide, top 80%, 509 students, 63% FRL); Central York Ms (math 21% / reading 59%, grade F, #257 of 512 statewide, top 52%, 881 students, 45% FRL); Central York Hs (math 61% / reading 74%, grade B, #59 of 437 statewide, top 14%, 1,807 students, 40% FRL) — zoned schools average 50% FRL vs 24% district-wide (26 pts higher); higher-poverty schools than district average — tighter screening recommended.
- Market conditions: Rents rising fast (+6.4%/yr); 252 active listings in the ZIP; 7 comparable units currently listed for rent nearby; rentals at typical pace (median 15d on market — plan ~3-4 weeks tenant-placement turnaround); solid renter incomes; 1,328 units permitted in York County in 2024 (338 in 5+ unit buildings).
Forward outlook
- Local home prices are declining (-3.0%/yr); year-one equity from $1k of loan paydown is wiped out by about $5k of value loss. Plan a longer hold.
Negotiation context
- It's been on market 42 days — a 3% lower offer ($155k) is reasonable based on typical stale-listing flexibility.
- 2 sale attempts with the ask held roughly flat each time — persistent listings suggest the price (not the market) is what's stuck; bring a comps-based counter.
Risks & watch-outs
- Climate carrying-cost: extreme-heat days projected 7→15/yr by 2055 (HVAC capex compounding) — expect insurance premiums to compound above CPI over the hold.
Questions for the listing agent
- What do current leases actually rent for vs. the listed asking? Can we see a recent rent roll and the last 12 months of T-12 income?
- It's been on market 42 days. Have you received any prior offers? Is the seller open to a 9% concession, seller financing, or rate buy-down credit?
- What does the HOA fee cover, when was the last increase, and are there any pending special assessments or reserve-fund shortfalls?
- Is there a deadline driving the sale (1031 exchange, divorce, estate, relocation)? That informs how much negotiation room exists.
- Crime grade is F in this area — have there been break-ins, vandalism, or insurance claims at this property in the last 3 years? What carrier currently insures it and at what premium?
- The area grade is low — what's the realistic commute time and amenity access for the typical tenant pool here? Any planned neighborhood developments (good or bad) we should know about?
- What's the average days-on-market for RENTAL listings here right now (not sales)? A rising rental-DOM trend means longer vacancies and softer asking-rent achievability than the comps imply.
- What's the recent tenant-quality profile in this submarket — average credit score on applications, eviction rate, late-payment / NSF rate, and stable-employment percentage? A property-management company in the area should have these aggregated.
- How much new for-sale + rental construction is in the pipeline within 1–3 miles? Heavy new supply typically softens prices + rents 12–24 months out; constrained supply supports both.
Investment metrics
- 1% rule
- 1.00% ✓
- Cap rate
- 5.58%
- Cash-on-cash
- -2.54%
- DSCR
- 0.89
- GRM
- 8.3
CMA / ARV
- ARV (on-the-fly)
- $201,600
- Comps found
- 12
Show comp detail 12 sales within ~0.75 mi
| Address | Dist | Beds/Ba | Sqft | Sold | Price | $/sf | Match |
|---|---|---|---|---|---|---|---|
| 98 Lexton Dr | 0.12mi | 2/1.5 | 1,050 (0%) | 4mo | $170,000 | $162 | 91 |
| 1014 Village Way | 0.14mi | 2/1.0 | 1,080 (+3%) | 1mo | $190,000 | $176 | 86 |
| 102 Lexton Dr #102 | 0.11mi | 2/1.5 | 1,092 (+4%) | 4mo | $172,000 | $158 | 85 |
| 1012 Village Way #1012 | 0.14mi | 2/1.0 | 1,080 (+3%) | 5mo | $195,000 | $181 | 83 |
| 755 Robin Hill Cir | 0.35mi | 2/1.5 | 1,050 (0%) | 4mo | $209,000 | $199 | 80 |
| 3016 Village Cir W | 0.26mi | 2/1.0 | 1,080 (+3%) | 7mo | $171,500 | $159 | 75 |
| 2350 Woodmont Dr | 0.19mi | 3/1.5 (+1) | 1,120 (+7%) | 1mo | $215,000 | $192 | 74 |
| 591 Hayley Rd | 0.66mi | 2/2.0 | 1,064 (+1%) | 3mo | $226,577 | $213 | 62 |
| 699 Hayley Rd | 0.67mi | 2/2.0 | 1,064 (+1%) | 4mo | $250,000 | $235 | 61 |
| 245 Robin Hill Cir | 0.32mi | 3/1.5 (+1) | 1,200 (+14%) | 3mo | $241,000 | $201 | 54 |
| 240 Robin Hill Cir | 0.30mi | 3/1.5 (+1) | 1,200 (+14%) | 4mo | $226,000 | $188 | 54 |
| 780 Robin Hill Cir | 0.37mi | 3/1.5 (+1) | 1,200 (+14%) | 1mo | $247,000 | $206 | 53 |
Match score weights: distance 35% · size 25% · config 20% · recency 20%. Top-matched comps best support the ARV.
Projected returns pro-forma
-3.0% appreciation · 6.38% rent growth · sell at horizon
- IRR
- -15.8%
- Equity multiple
- 0.42×
- Total profit
- $-26,154
- Equity at exit
- $23,856
- IRR
- -1.4%
- Equity multiple
- 0.89×
- Total profit
- $-5,035
- Equity at exit
- $13,834
Cash invested: $44,800 (down + closing). Projections, not guarantees.
Landlord ↔ Tenant lean methodology
- Overall (STATE)
- 62 Landlord-Friendly
- State Pennsylvania
- 62 Landlord-Friendly · EVEN
- County
- — inherits STATE
- City
- — inherits STATE
ZIP-level market 17404
- Rents YoY
- 6.4%
- Active inventory
- 252
- Price-to-rent
- 8.3×
Monthly cashflow live
- Estimated rent
- $1,602 high interval (Pro) →
- Mortgage (P&I)
- −$839
- Tax est. 1.5%
- −$200 /mo · $2,400/yr
- Insurance
- −$67
- HOA
- −$255
- Vacancy / Maint / Mgmt
- −$336
- Net cashflow
- $-95
Break-even live
Sensitivity live
| Price | -10% $16 | -5% $-40 | +0% $-95 | +5% $-150 | +10% $-205 |
|---|---|---|---|---|---|
| Rent | -10% $-221 | -5% $-158 | +0% $-95 | +5% $-32 | +10% $32 |
| Rate | -1.0pp $-14 | -0.5pp $-54 | base $-95 | +0.5pp $-136 | +1.0pp $-178 |
UW: 25.0% down · 7.5% · 30yr · 1.5% tax · 5.0% vac · 8.0% maint · 8.0% mgmt
Financing live
Cash to close
- Down payment
- $40,000
- Closing costs
- $4,800
- Reserves months
- —
- Total cash needed
- —
Loan-product check · same deal, 3 products live
Conventional
25% down · 7.5% · 30yr
- Down + closing
- —
- Monthly P&I
- —
- Monthly cashflow
- —
- DSCR
- —
- Eligible?
- —
Personal DTI + credit; lowest rate.
DSCR
20% down · 8.5% · 30yr
- Down + closing
- —
- Monthly P&I
- —
- Monthly cashflow
- —
- DSCR
- —
- Eligible?
- —
No personal income docs; deal must DSCR.
Hard money
10% down · 12.0% · 12mo
- Down + closing
- —
- Monthly P&I
- —
- Monthly cashflow
- —
- DSCR
- —
- Eligible?
- —
Short-term bridge; refi at stabilization.
Rent comps 7 comps
| Address | Beds | Baths | Sqft | Rent | $/sqft | DOM | Units | Dist |
|---|---|---|---|---|---|---|---|---|
| 2220 N Susquehanna Trl York, PA | 1.0–3.0 | 1.0–2.0 | 1073 | $2,050 | $1.91 | 15d | 14 | 0.22mi |
| 433 Piedmont Cir York, PA | 3.0 | 1.5 | 1000 | $1,656 | $1.66 | 45d | 1 | 0.67mi |
| 433 Piedmont Cir York, PA | 1.0–3.0 | 1.0–1.5 | 850 | $1,505 | $1.77 | 15d | 2 | 0.67mi |
| 2256 N Point Dr York, PA | 2.0 | 1.5 | 1200 | $1,650 | $1.38 | 45d | 1 | 0.76mi |
| 217 Cedar Village Dr York, PA | 1.0–3.0 | 1.5 | 1025 | $1,515 | $1.48 | 15d | 1 | 1.10mi |
| 1100 Schley Aly York, PA | 1.0 | 1.0 | 911 | $1,195 | $1.31 | 15d | 1 | 1.37mi |
| 42 Laurel St York, PA | 3.0 | 1.0 | 1136 | $1,375 | $1.21 | 22d | 1 | 1.44mi |
HOA detail
- Monthly dues
- $255 · $3,060/yr
Listing history 7 events
-
2026-06-21statusdays on market $159,999 Active 42 DOM
-
2026-04-30status Pending
-
2026-04-21status Active
-
2026-03-31status Pending
-
2026-03-24price $159,999
-
2026-03-01$165,000 Active
-
2026-02-26historical $165,000
ⓘ Source: listings_history table (triggers on properties + properties_extension) + one-shot
backfill from property_details.listing_events for pre-trigger history.
Climate risk First Street
- Flood 4/10 Moderate FEMA zone X (unshaded) · 20% chance over 30 yrs
- Wildfire 1/10 Low
- Heat 5/10 Major 7 d/yr ≥103°F today · 15 d/yr by 30 yrs out
- Wind 4/10 Moderate 11% chance of damaging wind over 30 yrs
- Air quality 3/10 Moderate 3 unhealthy d/yr today · 5 by 30 yrs out
Nearby sold comps map
Loading sold comps map…
Walkable amenities ~0.75 mi
Loading nearby amenities…
Taxation est. · year 1
- Rental income
- $19,228
- − Mortgage interest
- −$8,962
- − Property taxes
- −$2,400
- − Insurance
- −$800
- − Repairs & maintenance
- −$1,538
- − Management
- −$1,538
- − HOA
- −$3,060
- − Depreciation
- −$4,655
- Taxable loss
- −$3,725
- Est. tax savings @ 24.0%
- +$894
- After-tax cash flow
- $-244/yr
For passive investors: Depreciation is non-cash, so a rental often shows a tax loss while cash-flowing — sheltering income. Rental losses are passive: they offset passive income freely, and up to $25,000/yr can offset ordinary (W-2) income if you actively participate and your MAGI is under $100k (phasing out to $0 by $150k); unused losses carry forward. On sale, claimed depreciation is recaptured at up to 25%, and gains may owe capital-gains tax (a 1031 exchange can defer both). Figures are a year-1 estimate at your 24.0% rate — not tax advice; consult a CPA.
Condition & rehab AI · 14 photos
This 2-bedroom, 1.5-bath townhouse is in average condition with some cosmetic updates needed. The home has a manageable footprint and low-maintenance living, making it an appealing option for those looking to personalize and update the space.
Repairs flagged
- Minor Kitchen cabinets — The cabinets are dated and could be replaced for a fresh look.
- Minor Kitchen tile floor — The tile floor is dated and could be replaced for a more modern look.
- Minor Bathroom fixtures — The fixtures are dated and could be replaced for a more modern look.
- Minor Bathroom cabinetry — The cabinetry is dated and could be replaced for a more modern look.
Value-add opportunities
- Resale New kitchen cabinets and tile floor — Updating the kitchen will make the home more appealing to potential buyers.
- Resale New bathroom fixtures and cabinetry — Updating the bathrooms will make the home more appealing to potential buyers.
- Both Landscaping and curb appeal improvements — Improving the landscaping will enhance the home's curb appeal and increase its value.
Renovation cost estimate screening
| Repair item | Severity | Est. cost |
|---|---|---|
| Kitchen cabinets · The cabinets are dated and could be replaced for a fresh look. | Minor | $500–3,000 |
| Kitchen tile floor · The tile floor is dated and could be replaced for a more modern look. | Minor | $500–3,000 |
| Bathroom fixtures · The fixtures are dated and could be replaced for a more modern look. | Minor | $500–3,000 |
| Bathroom cabinetry · The cabinetry is dated and could be replaced for a more modern look. | Minor | $500–3,000 |
| Total estimated repair cost · 4 items | $2,000–12,000 |
Value-add ROI direction
- Resale New kitchen cabinets and tile floor — Updating the kitchen will make the home more appealing to potential buyers. ↑
- Resale New bathroom fixtures and cabinetry — Updating the bathrooms will make the home more appealing to potential buyers. ↑
- Both Landscaping and curb appeal improvements — Improving the landscaping will enhance the home's curb appeal and increase its value. ↑
ⓘ Cost ranges are severity-bucket heuristics (US national rule-of-thumb). Get contractor quotes + a written scope before underwriting a rehab budget.
Schools (NCES district)
- District
- Central York SD
- NCES district ID
- 4205490
- Math proficiency
- 33% ▼ -2.00%
- Reading proficiency
- 57% ▼ -4.00%
- Median HH income
- $64,385
- Composite
- 39.92/100
- National rank
- #3849
- State rank
- #244 of 539 in PA
Livability — York
- Score
- 75/100
- State rank
- #427
- US rank
- #3987
Category grades
Schools grade is shown separately in the Schools card above.
Census & demographics
- County
- York County · 278,806 people
- City population
- 184,764
- Metro
- York-Hanover, PA
- Population (ZIP)
- 39,374
- Household income
- $78,506
- Rent vs Own
- Severe rent burden
- 722.0
Population outlook (York County) Hauer SSP2
- Today (2025)
- 454,205 people
- By 2030
- 457,407 · +0.7%
- By 2040
- 457,529 · +0.7%
- By 2050
- 448,261 · -1.3%
- By 2075
- 427,388 · -5.9%
- By 2100
- 384,218 · -15.4%
Race, ethnicity, and origin ACS 2023
- Neighborhood character
- Majority White (65%)
- Race & ethnicity
- White 65% Hispanic / Latino 19% Black 12% Two or more races 8%
- Hispanic origin (detail)
- Mexican 2% Puerto Rican 9% Dominican 4%
- Common ancestry
- Romanian 2% Slovak 2% Lithuanian 1%
- Foreign-born
- 6% · Canada, Vietnam
- Languages at home
- 85% English-only · Spanish 12% Russian/Polish/Slavic 1%
Political lean MEDSL · York
- 2024 margin
- Strong R (+25.3) · D 36.9% · R 62.1%
- 2008→2024 swing
- -11.7pp toward R · 2008: -13.6pp · 2024: -25.3pp
- All cycles
- 2024: R+25.3 2020: R+24.6 2016: R+29.3 2012: R+21.2 2008: R+13.6
Not yet ingested
- Civics
- —
Market trends
- HPI YoY
- ▼ -135.44%
- Current HPI
- 237.5683
- Rent YoY
- ▲ 6.38%
- Metro
- York-Hanover, PA
- State GDP YoY
- ▲ 1.68%
- F500 in state
- 34
Industry mix (Fortune 500 HQ in PA)
| Industry | F500 HQs | Revenue |
|---|---|---|
| Healthcare | 2 | $309B |
|
||
| Insurance | 2 | $27B |
|
||
| Telecommunications / Media | 1 | $124B |
|
||
| Industrial Distribution | 1 | $22B |
|
||
| Financial Services | 1 | $20B |
|
||
| Chemicals / Materials | 1 | $18B |
|
||
Price history
-3.0% since first listed6 events — show timeline
- 2026-04-30 Pending — BRIGHT MLS
- 2026-04-21 Relisted — BRIGHT MLS
- 2026-03-31 Pending — BRIGHT MLS
- 2026-03-24 Price Changed $159,999 BRIGHT MLS
- 2026-03-01 Listed $165,000 BRIGHT MLS
- 2026-02-26 Coming Soon $165,000 BRIGHT MLS
Cash-flow waterfall
monthlySold comps — $/sqft
last 12 mo · ≤1 miLoading sold comps…