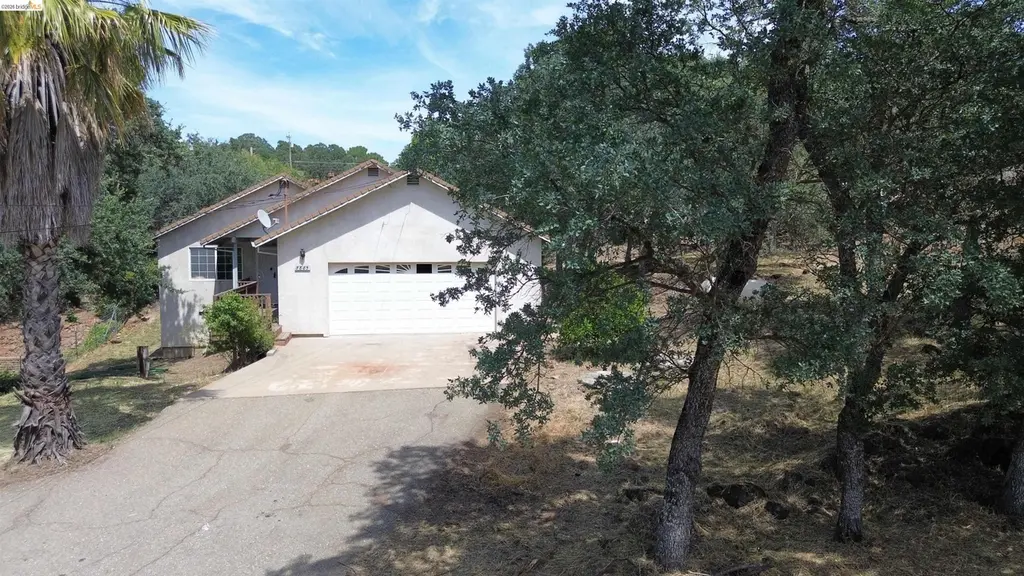
3885 Bartelink Dr · Rancho Calaveras, CA
Flood risk 1/10 · Minimal
- FEMA flood zone
- X (unshaded)
- Chance of flooding over 30 yrs
- 0.0%
- Est. flood insurance / yr
- $507 – $1,088
Fire risk 9/10 · Severe
- Est. fire insurance / yr
- $659 – $1,223
Heat risk 7/10 · Major
- Hot days now (above 103°F)
- 7 days/yr
- Hot days in 30 yrs
- 16 days/yr
Wind risk 1/10 · Minimal
- Chance of severe wind over 30 yrs
- —
Air-quality risk 10/10 · Severe
- Unhealthy air days now
- 29 days/yr
- Unhealthy air days in 30 yrs
- 31 days/yr
Risk factors via First Street. Map © Google.
Why this score? — see what drove the C+ grade
The composite is a weighted blend of 9 inputs, each scored 0–100. Each bar is that input's sub-score; the figure is the points it added to the 100-point composite (weight × sub-score).
- Cash flow +24.6/30.0
- ARV discount +15.0/15.0
- DSCR +7.9/10.0
- 1% rule +6.4/10.0
- Livability +2.6/5.0
- Rent growth +2.5/5.0
- Condition / age +2.5/5.0
- Schools +2.0/10.0
- Appreciation +0.0/10.0
$249,900
🖨 Deal sheet (PDF) 📄 Offer letter ✓ Due diligence
Listing remarks
Discover this charming 2-bed, 2-bath home in Valley Springs. Built in 2004 on a generous 0.5-acre lot, this 1,162 sqft single-family residence offers a flexible den with a closet, perfect for a home office or extra bedroom. The interior presents an opportunity for personalization with refreshed flooring and a renewed color palette. Climate control systems are ready for attention to ensure year-round comfort. This property invites you to create your ideal living space. Some photos have been virtually staged.
Key facts
- 0.5 acre lot
- 2 garage spots
- Built 2004
Property features AI
Exterior
- Parking: Attached garage; 2 covered parking spaces; 2 garage spaces
- Utilities: Public water
- Home design: Single family residence; Residential property; Built in 2004
- Construction: Stucco siding
- Exterior features: Front yard; Back yard; Side yard; Yard space
Interior
- Kitchen: Other kitchen features
- Bedrooms: 2 bedrooms
- Flooring: Carpet
- Bathrooms: 2 full bathrooms
- Heating & cooling: Central air; Has heating
- Interior features: Den; Fireplace
- Laundry & utility: Laundry in garage
Neighborhood map
What this means for you Summary
Snapshot
- This is a 2-bed/2.0-bath single-family listed at $250k.
Deal economics
- At list price, monthly cash flow is $517 ($6k/yr) — positive.
- The deal already cash-flows at list — no discount required.
- Meets the 1% rule at list price ($3k rent vs $250k).
- Recommended offer: $246k (1.5% below list) — sets the bar for market timing.
- Cap rate 8.8% vs local median 2.8% in Rancho Calaveras — top-decile yield for the area; either an underpriced asset or a hidden risk that comps aren't pricing in. Stress-test before assuming the spread holds.
Location & tenants
- Location reads 52/100 on livability (#998 in CA) — a working-class tenant base; expect higher turnover. Strengths: housing A+, employment B; Watch: crime D-, amenities F, commute F.
- Calaveras Unified (rural): math 16% / reading 28% proficiency, ranked #436 of 517 in CA (top 84%) — low school quality limits family demand, transient renter base, plan for 1-2y turnover.
- Zoned schools: Jenny Lind Elementary (math 8% / reading 22%, grade F, #1,420 of 1,571 statewide, top 91%, 442 students, 42% FRL); Toyon Middle (math 14% / reading 29%, grade F, #400 of 498 statewide, top 82%, 531 students, 46% FRL); Calaveras High (math 27% / reading 52%, grade F, #532 of 1,170 statewide, top 48%, 746 students, 36% FRL).
- Market conditions: 186 active listings in the ZIP; 1 comparable units currently listed for rent nearby; 77 units permitted in Calaveras County in 2024 (0 in 5+ unit buildings).
Forward outlook
- Local home prices are declining (-3.0%/yr); year-one equity from $2k of loan paydown is wiped out by about $7k of value loss. Plan a longer hold.
- Calaveras County population projected at -18% by 2050 — secular population decline; favor cash flow + early exit over multi-decade hold.
Negotiation context
- It's been on market 15 days — a 2% lower offer ($246k) is reasonable based on typical stale-listing flexibility.
Risks & watch-outs
- Climate carrying-cost: severe wildfire risk; extreme-heat days projected 7→16/yr by 2055 (HVAC capex compounding) — expect insurance premiums to compound above CPI over the hold.
Questions for the listing agent
- Is there a deadline driving the sale (1031 exchange, divorce, estate, relocation)? That informs how much negotiation room exists.
- Schools are F-rated, which usually means shorter tenancies and higher turnover. Who's the typical renter profile here, and what's been the actual vacancy rate?
- Crime grade is D in this area — have there been break-ins, vandalism, or insurance claims at this property in the last 3 years? What carrier currently insures it and at what premium?
- What's the average days-on-market for RENTAL listings here right now (not sales)? A rising rental-DOM trend means longer vacancies and softer asking-rent achievability than the comps imply.
- What's the recent tenant-quality profile in this submarket — average credit score on applications, eviction rate, late-payment / NSF rate, and stable-employment percentage? A property-management company in the area should have these aggregated.
- How much new for-sale + rental construction is in the pipeline within 1–3 miles? Heavy new supply typically softens prices + rents 12–24 months out; constrained supply supports both.
Investment metrics
- 1% rule
- 1.14% ✓
- Cap rate
- 8.78%
- Cash-on-cash
- 8.87%
- DSCR
- 1.39
- GRM
- 7.3
CMA / ARV
- ARV (on-the-fly)
- $376,488
- Comps found
- 4
Show comp detail 4 sales within ~0.75 mi
| Address | Dist | Beds/Ba | Sqft | Sold | Price | $/sf | Match |
|---|---|---|---|---|---|---|---|
| 4276 Hartvickson Ln | 0.45mi | 3/2.0 (+1) | 1,135 (-2%) | 1mo | $367,500 | $324 | 69 |
| 3068 Hartvickson Ln | 0.69mi | 3/2.0 (+1) | 1,134 (-2%) | 1mo | $365,000 | $322 | 58 |
| 5598 Cox Dr | 0.16mi | 3/2.0 (+1) | 1,315 (+13%) | 15mo | $460,000 | $350 | 53 |
| 3816 Dunn Rd | 0.74mi | 3/2.0 (+1) | 1,279 (+10%) | 12mo | $400,000 | $313 | 34 |
Match score weights: distance 35% · size 25% · config 20% · recency 20%. Top-matched comps best support the ARV.
Projected returns pro-forma
-3.0% appreciation · 3.0% rent growth · sell at horizon
- IRR
- -2.9%
- Equity multiple
- 0.89×
- Total profit
- $-7,521
- Equity at exit
- $37,261
- IRR
- 6.9%
- Equity multiple
- 1.52×
- Total profit
- $36,043
- Equity at exit
- $21,607
Cash invested: $69,972 (down + closing). Projections, not guarantees.
Landlord ↔ Tenant lean methodology
- Overall (STATE)
- 18 Strongly Tenant-Friendly
- State California
- 18 Strongly Tenant-Friendly · D+13
- County
- — inherits STATE
- City
- — inherits STATE
ZIP-level market 95252
- Active inventory
- 186
- Price-to-rent
- 7.3×
Monthly cashflow live
- Estimated rent
- $2,850 medium interval (Pro) →
- Mortgage (P&I)
- −$1,311
- Tax from tax record
- −$320 /mo · $3,839/yr
- Insurance
- −$104
- HOA
- −$0
- Vacancy / Maint / Mgmt
- −$598
- Net cashflow
- $517
Break-even live
Sensitivity live
| Price | -10% $658 | -5% $588 | +0% $517 | +5% $446 | +10% $376 |
|---|---|---|---|---|---|
| Rent | -10% $292 | -5% $404 | +0% $517 | +5% $630 | +10% $742 |
| Rate | -1.0pp $643 | -0.5pp $581 | base $517 | +0.5pp $452 | +1.0pp $386 |
UW: 25.0% down · 7.5% · 30yr · 1.5% tax · 5.0% vac · 8.0% maint · 8.0% mgmt
Financing live
Cash to close
- Down payment
- $62,475
- Closing costs
- $7,497
- Reserves months
- —
- Total cash needed
- —
Loan-product check · same deal, 3 products live
Conventional
25% down · 7.5% · 30yr
- Down + closing
- —
- Monthly P&I
- —
- Monthly cashflow
- —
- DSCR
- —
- Eligible?
- —
Personal DTI + credit; lowest rate.
DSCR
20% down · 8.5% · 30yr
- Down + closing
- —
- Monthly P&I
- —
- Monthly cashflow
- —
- DSCR
- —
- Eligible?
- —
No personal income docs; deal must DSCR.
Hard money
10% down · 12.0% · 12mo
- Down + closing
- —
- Monthly P&I
- —
- Monthly cashflow
- —
- DSCR
- —
- Eligible?
- —
Short-term bridge; refi at stabilization.
Rent comps 1 comps
| Address | Beds | Baths | Sqft | Rent | $/sqft | DOM | Units | Dist |
|---|---|---|---|---|---|---|---|---|
| 4447 Baldwin Ln Valley Springs, CA | 3.0 | 2.0 | 1320 | $2,850 | $2.16 | 20d | 1 | 1.04mi |
Listing history 8 events
-
2026-06-07statusdays on market $249,900 Pending 15 DOM
-
2026-06-04days on market $249,900 Active 13 DOM
-
2026-06-02days on market $249,900 Active 12 DOM
-
2026-06-01days on market $249,900 Active 11 DOM
-
2026-05-31days on market $249,900 Active 10 DOM
-
2026-05-31days on market $249,900 Active 9 DOM
-
2026-05-21$249,900 Active
-
2004-10-15soldstatus $236,000
ⓘ Source: listings_history table (triggers on properties + properties_extension) + one-shot
backfill from property_details.listing_events for pre-trigger history.
Tax reassessment forecast CA · Resets to sale price
- Current annual tax
- $3,839 · $320/mo
- Projected year-2 tax
- $3,839 · $320/mo
- Expected delta
- $0/yr ($0/mo · 0.0%)
ⓘ Screening estimate from a state-policy table — verify with the county assessor before closing.
Climate risk First Street
- Flood 1/10 Low FEMA zone X (unshaded) · 0% chance over 30 yrs
- Wildfire 9/10 Extreme
- Heat 7/10 Severe 7 d/yr ≥103°F today · 16 d/yr by 30 yrs out
- Wind 1/10 Low
- Air quality 10/10 Extreme 29 unhealthy d/yr today · 31 by 30 yrs out
Nearby sold comps map
Loading sold comps map…
Walkable amenities ~0.75 mi
Loading nearby amenities…
Taxation est. · year 1
- Rental income
- $34,200
- − Mortgage interest
- −$13,998
- − Property taxes
- −$3,839
- − Insurance
- −$1,250
- − Repairs & maintenance
- −$2,736
- − Management
- −$2,736
- − Depreciation
- −$7,270
- Taxable income
- $2,372
- Est. tax owed @ 24.0%
- −$569
- After-tax cash flow
- $5,634/yr
For passive investors: Depreciation is non-cash, so a rental often shows a tax loss while cash-flowing — sheltering income. Rental losses are passive: they offset passive income freely, and up to $25,000/yr can offset ordinary (W-2) income if you actively participate and your MAGI is under $100k (phasing out to $0 by $150k); unused losses carry forward. On sale, claimed depreciation is recaptured at up to 25%, and gains may owe capital-gains tax (a 1031 exchange can defer both). Figures are a year-1 estimate at your 24.0% rate — not tax advice; consult a CPA.
Schools (NCES district)
- District
- Calaveras Unified
- NCES district ID
- 0606870
- Math proficiency
- 16% ▼ -10.00%
- Reading proficiency
- 28% ▼ -8.00%
- Median HH income
- $55,559
- Composite
- 20.06/100
- National rank
- #8654
- State rank
- #436 of 517 in CA
Livability — Rancho Calaveras
- Score
- 52/100
- State rank
- #998
- US rank
- #24806
Category grades
Schools grade is shown separately in the Schools card above.
Census & demographics
- Census place
- Rancho Calaveras, CA
- City population
- 13,851
- Population (ZIP)
- 13,851
Population outlook (Calaveras County) Hauer SSP2
- Today (2025)
- 43,163 people
- By 2030
- 41,703 · -3.4%
- By 2040
- 38,202 · -11.5%
- By 2050
- 35,385 · -18.0%
- By 2075
- 30,807 · -28.6%
- By 2100
- 25,755 · -40.3%
Race, ethnicity, and origin ACS 2023
- Neighborhood character
- Predominantly White (71%)
- Race & ethnicity
- White 71% Hispanic / Latino 18% Two or more races 16% Asian 5%
- Hispanic origin (detail)
- Mexican 13% Puerto Rican 1%
- Common ancestry
- Slovak 4% Italian 2% Lithuanian 2%
- Foreign-born
- 7% · Canada, Jamaica, China
- Languages at home
- 86% English-only · Spanish 9% Tagalog/Filipino 2% Chinese 2%
Political lean MEDSL · Calaveras
- 2024 margin
- Strong R (+28.1) · D 34.7% · R 62.8% · Other 2.5%
- 2008→2024 swing
- -15.2pp toward R · 2008: -13.0pp · 2024: -28.1pp
- All cycles
- 2024: R+28.1 2020: R+23.8 2016: R+23.9 2012: R+17.0 2008: R+13.0
Not yet ingested
- Civics
- —
Market trends
- HPI YoY
- ▼ -167.82%
- Current HPI
- 203.4389
- Rent YoY
- —
- Metro
- —
- State GDP YoY
- ▲ 3.21%
- F500 in state
- 116
Industry mix (Fortune 500 HQ in CA)
| Industry | F500 HQs | Revenue |
|---|---|---|
| Technology | 27 | $1,492B |
|
||
| Financial Services | 3 | $174B |
|
||
| Retail | 3 | $44B |
|
||
| Insurance | 3 | $26B |
|
||
| Media / Entertainment | 2 | $115B |
|
||
| Pharmaceuticals / Biotech | 2 | $62B |
|
||
Price history
+5.9% since first listed3 events — show timeline
- 2026-06-05 Pending — bridgeMLS, Bay East AOR, or Contra Costa AOR
- 2026-05-21 Listed $249,900 bridgeMLS, Bay East AOR, or Contra Costa AOR
- 2004-10-15 Sold (Public Records) $236,000 Public Records
Property tax history
+7.7%/yrLatest (2025): $3,839 · +0.2% YoY. Source: county tax records.
Cash-flow waterfall
monthlySold comps — $/sqft
last 12 mo · ≤1 miLoading sold comps…