 🏷️ Likely Rental
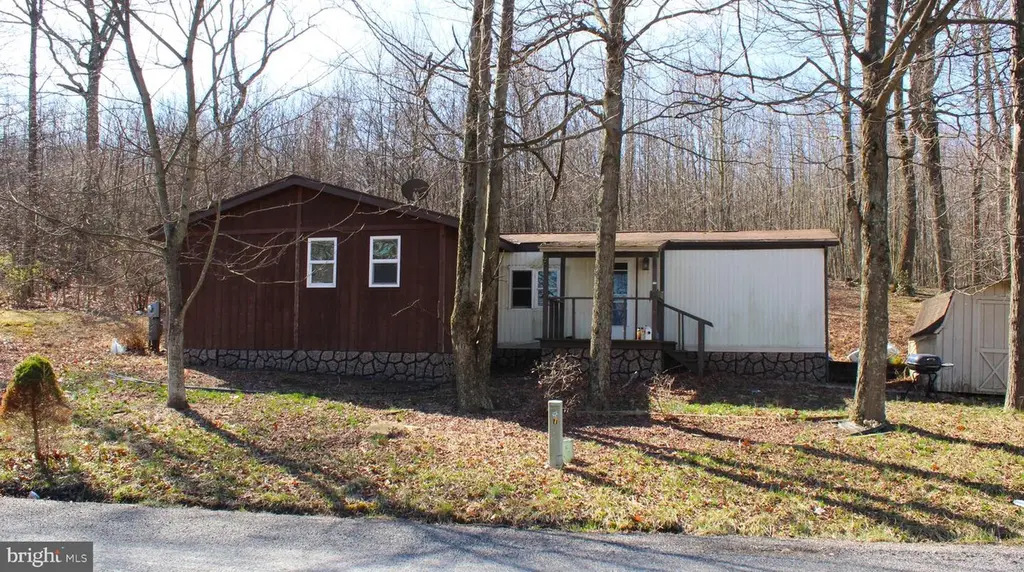
15904 Woodsview Dr · Eckhart Mines, MD
Flood risk No data
- FEMA flood zone
- —
- Chance of flooding over 30 yrs
- —
- Est. flood insurance / yr
- —
Fire risk No data
- Est. fire insurance / yr
- —
Heat risk No data
- Hot days now (above threshold)
- —
- Hot days in 30 yrs
- —
Wind risk No data
- Chance of severe wind over 30 yrs
- —
Air-quality risk No data
- Unhealthy air days now
- —
- Unhealthy air days in 30 yrs
- —
Risk factors via First Street. Map © Google.
Why this score? — see what drove the B- grade
The composite is a weighted blend of 9 inputs, each scored 0–100. Each bar is that input's sub-score; the figure is the points it added to the 100-point composite (weight × sub-score).
- Cash flow +30.0/30.0
- 1% rule +10.0/10.0
- DSCR +10.0/10.0
- ARV discount +7.5/15.0
- Livability +2.8/5.0
- Rent growth +2.5/5.0
- Condition / age +2.2/5.0
- Schools +1.9/10.0
- Appreciation +0.0/10.0
$38,000
🖨 Deal sheet (PDF) 📄 Offer letter ✓ Due diligence
Listing remarks MLS
SELLER MOTIVATED AND SAYS LOOKING FOR A QUICK SALE - THIS MOBILE HOME SITS ON A RENTED LOT IN A NICE MOBILE HOME PARK. NICE SIZE RENTED LOTS NOT YOUR TYPICAL RENTED LOTS YOU SEE IN OTHER PARKS- LOT RENT $425.00 PER MONTH PLUS $150.00 FOR WATER - SEWER & TRASH - 2 NICE SIZE BEDROOMS - 2 FULL BATHS - POSSIBLE 3RD BEDROOM - NICE KITCHEN WITH AMPLE CABINETS - RELAX ON THE COVERED FRONT PORCH - ONE BEDROOM IS ACTUALLY A LARGE ADDITION ADDED TO THE ORIGINAL MOBILE - NO RENT TO OWN. THIS IS A NICE MOBILE HOME PARK NOW CALLED MORIAH PARK. NO RENT TO OWN. DRIVEWAY
Key facts
- Built 2018
- Listed 84 days
Neighborhood map
What this means for you Summary
Snapshot
- This is a 2-bed/2.0-bath single-family listed at $38k. Condition is rated fair.
Deal economics
- At list price, monthly cash flow is $656 ($8k/yr) — positive.
- The deal already cash-flows at list — no discount required.
- Meets the 1% rule at list price ($1k rent vs $38k).
- Recommended offer: $36k (6.0% below list) — sets the bar for market timing.
Location & tenants
- Location reads 56/100 on livability (#410 in MD) — a working-class tenant base; expect higher turnover. Strengths: cost of living A+, employment B; Watch: crime F, amenities F, commute F.
- Allegany County Public Schools (other): math 15% / reading 30% proficiency, ranked #18 of 24 in MD (top 75%) — low school quality limits family demand, transient renter base, plan for 1-2y turnover.
- Zoned schools: Beall Elementary (math 19% / reading 30%, grade F, #260 of 860 statewide, top 33%, 451 students, 63% FRL); Mount Savage Middle (math 15% / reading 38%, grade F, #86 of 225 statewide, top 40%, 425 students, 54% FRL); Mountain Ridge High School (math 32% / reading 72%, grade D+, #100 of 222 statewide, top 47%, 736 students, 48% FRL).
- Market conditions: 102 active listings in the ZIP; 24 units permitted in Allegany County in 2024 (0 in 5+ unit buildings).
Forward outlook
- Local home prices are declining (-3.0%/yr); year-one equity from $263 of loan paydown is wiped out by about $1k of value loss. Plan a longer hold.
- Allegany County population projected at -14% by 2050 — secular population decline; favor cash flow + early exit over multi-decade hold.
- At projected returns (-3.0% appreciation + 3.0% rent growth), your $11k cash investment doubles in ~2 years — after that, you're playing with house money.
Negotiation context
- It's been on market 84 days — a 6% lower offer ($36k) is reasonable based on typical stale-listing flexibility.
Questions for the listing agent
- It's been on market 84 days. Have you received any prior offers? Is the seller open to a 6% concession, seller financing, or rate buy-down credit?
- Have any recent inspections been done? Can we get a copy of the seller's disclosures and any deferred-maintenance estimates?
- Why hasn't it sold? Are there any deal-killer items the seller is aware of (foundation, flood, title, zoning, code violations)?
- Is there a deadline driving the sale (1031 exchange, divorce, estate, relocation)? That informs how much negotiation room exists.
- Schools are F-rated, which usually means shorter tenancies and higher turnover. Who's the typical renter profile here, and what's been the actual vacancy rate?
- Crime grade is F in this area — have there been break-ins, vandalism, or insurance claims at this property in the last 3 years? What carrier currently insures it and at what premium?
- What's the average days-on-market for RENTAL listings here right now (not sales)? A rising rental-DOM trend means longer vacancies and softer asking-rent achievability than the comps imply.
- What's the recent tenant-quality profile in this submarket — average credit score on applications, eviction rate, late-payment / NSF rate, and stable-employment percentage? A property-management company in the area should have these aggregated.
- How much new for-sale + rental construction is in the pipeline within 1–3 miles? Heavy new supply typically softens prices + rents 12–24 months out; constrained supply supports both.
Investment metrics
- 1% rule
- 3.06% ✓
- Cap rate
- 27.00%
- Cash-on-cash
- 73.96%
- DSCR
- 4.29
- GRM
- 2.7
CMA / ARV
- ARV (median comp)
- $105,716
- List price
- $38,000
- Delta
- -64.05%
- Verdict
- UNDERPRICED
- Comps
- 12 within 1.0 mi
Show comp detail 2 sales within ~0.75 mi
| Address | Dist | Beds/Ba | Sqft | Sold | Price | $/sf | Match |
|---|---|---|---|---|---|---|---|
| 15829 Woodsview Dr | 0.03mi | 2/1.0 | 980 (-11%) | 8mo | $29,900 | $31 | 70 |
| 16805 Turk Ln | 0.74mi | 3/1.0 (+1) | 1,105 (+0%) | 13mo | $134,900 | $122 | 45 |
Match score weights: distance 35% · size 25% · config 20% · recency 20%. Top-matched comps best support the ARV.
Projected returns pro-forma
-3.0% appreciation · 3.0% rent growth · sell at horizon
- IRR
- 73.8%
- Equity multiple
- 4.35×
- Total profit
- $35,629
- Equity at exit
- $5,666
- IRR
- 77.6%
- Equity multiple
- 8.98×
- Total profit
- $84,882
- Equity at exit
- $3,286
Cash invested: $10,640 (down + closing). Projections, not guarantees.
Landlord ↔ Tenant lean methodology
- Overall (STATE)
- 27 Tenant-Leaning
- State Maryland
- 27 Tenant-Leaning · D+14
- County
- — inherits STATE
- City
- — inherits STATE
ZIP-level market 21532
- Home prices YoY
- -24.2%
- Active inventory
- 102
- Price-to-rent
- 2.7×
Monthly cashflow live
- Estimated rent
- $1,163 medium interval (Pro) →
- Mortgage (P&I)
- −$199
- Tax est. 1.5%
- −$48 /mo · $570/yr
- Insurance
- −$16
- HOA
- −$0
- Vacancy / Maint / Mgmt
- −$244
- Net cashflow
- $656
Break-even live
Sensitivity live
| Price | -10% $682 | -5% $669 | +0% $656 | +5% $643 | +10% $630 |
|---|---|---|---|---|---|
| Rent | -10% $564 | -5% $610 | +0% $656 | +5% $702 | +10% $748 |
| Rate | -1.0pp $675 | -0.5pp $665 | base $656 | +0.5pp $646 | +1.0pp $636 |
UW: 25.0% down · 7.5% · 30yr · 1.5% tax · 5.0% vac · 8.0% maint · 8.0% mgmt
Financing live
Cash to close
- Down payment
- $9,500
- Closing costs
- $1,140
- Reserves months
- —
- Total cash needed
- —
Loan-product check · same deal, 3 products live
Conventional
25% down · 7.5% · 30yr
- Down + closing
- —
- Monthly P&I
- —
- Monthly cashflow
- —
- DSCR
- —
- Eligible?
- —
Personal DTI + credit; lowest rate.
DSCR
20% down · 8.5% · 30yr
- Down + closing
- —
- Monthly P&I
- —
- Monthly cashflow
- —
- DSCR
- —
- Eligible?
- —
No personal income docs; deal must DSCR.
Hard money
10% down · 12.0% · 12mo
- Down + closing
- —
- Monthly P&I
- —
- Monthly cashflow
- —
- DSCR
- —
- Eligible?
- —
Short-term bridge; refi at stabilization.
Listing history 18 events
-
2026-06-22days on market $38,000 Active 84 DOM
-
2026-06-21days on market $38,000 Active 83 DOM
-
2026-06-19days on market $38,000 Active 81 DOM
-
2026-06-18days on market $38,000 Active 80 DOM
-
2026-06-17days on market $38,000 Active 79 DOM
-
2026-06-16days on market $38,000 Active 78 DOM
-
2026-06-15days on market $38,000 Active 77 DOM
-
2026-06-14days on market $38,000 Active 75 DOM
-
2026-06-12days on market $38,000 Active 74 DOM
-
2026-06-09days on market $38,000 Active 71 DOM
-
2026-06-08days on market $38,000 Active 70 DOM
-
2026-06-07days on market $38,000 Active 69 DOM
-
2026-06-02days on market $38,000 Active 64 DOM
-
2026-06-01days on market $38,000 Active 63 DOM
-
2026-05-31days on market $38,000 Active 62 DOM
-
2026-05-30days on market $38,000 Active 61 DOM
-
2026-03-30$38,000 Active 569-char remark
Show marketing remark (569 chars)
SELLER MOTIVATED AND SAYS LOOKING FOR A QUICK SALE - THIS MOBILE HOME SITS ON A RENTED LOT IN A NICE MOBILE HOME PARK. NICE SIZE RENTED LOTS NOT YOUR TYPICAL RENTED LOTS YOU SEE IN OTHER PARKS- LOT RENT $425.00 PER MONTH PLUS $150.00 FOR WATER - SEWER & TRASH - 2 NICE SIZE BEDROOMS - 2 FULL BATHS - POSSIBLE 3RD BEDROOM - NICE KITCHEN WITH AMPLE CABINETS - RELAX ON THE COVERED FRONT PORCH - ONE BEDROOM IS ACTUALLY A LARGE ADDITION ADDED TO THE ORIGINAL MOBILE - NO RENT TO OWN. THIS IS A NICE MOBILE HOME PARK NOW CALLED MORIAH PARK. NO RENT TO OWN. DRIVEWAY
-
2026-03-27historical $38,000 569-char remark
Show marketing remark (569 chars)
SELLER MOTIVATED AND SAYS LOOKING FOR A QUICK SALE - THIS MOBILE HOME SITS ON A RENTED LOT IN A NICE MOBILE HOME PARK. NICE SIZE RENTED LOTS NOT YOUR TYPICAL RENTED LOTS YOU SEE IN OTHER PARKS- LOT RENT $425.00 PER MONTH PLUS $150.00 FOR WATER - SEWER & TRASH - 2 NICE SIZE BEDROOMS - 2 FULL BATHS - POSSIBLE 3RD BEDROOM - NICE KITCHEN WITH AMPLE CABINETS - RELAX ON THE COVERED FRONT PORCH - ONE BEDROOM IS ACTUALLY A LARGE ADDITION ADDED TO THE ORIGINAL MOBILE - NO RENT TO OWN. THIS IS A NICE MOBILE HOME PARK NOW CALLED MORIAH PARK. NO RENT TO OWN. DRIVEWAY
ⓘ Source: listings_history table (triggers on properties + properties_extension) + one-shot
backfill from property_details.listing_events for pre-trigger history.
Nearby sold comps map
Loading sold comps map…
Walkable amenities ~0.75 mi
Loading nearby amenities…
Taxation est. · year 1
- Rental income
- $13,951
- − Mortgage interest
- −$2,129
- − Property taxes
- −$570
- − Insurance
- −$190
- − Repairs & maintenance
- −$1,116
- − Management
- −$1,116
- − Depreciation
- −$1,105
- Taxable income
- $7,725
- Est. tax owed @ 24.0%
- −$1,854
- After-tax cash flow
- $6,016/yr
For passive investors: Depreciation is non-cash, so a rental often shows a tax loss while cash-flowing — sheltering income. Rental losses are passive: they offset passive income freely, and up to $25,000/yr can offset ordinary (W-2) income if you actively participate and your MAGI is under $100k (phasing out to $0 by $150k); unused losses carry forward. On sale, claimed depreciation is recaptured at up to 25%, and gains may owe capital-gains tax (a 1031 exchange can defer both). Figures are a year-1 estimate at your 24.0% rate — not tax advice; consult a CPA.
Condition & rehab AI · 13 photos
The home requires extensive repairs and maintenance, including replacing exposed subfloor and cabinets, repairing siding, and cleaning up debris. These updates would significantly increase its resale and rental value.
Repairs flagged
- Major Exposed subfloor in kitchen and bath — Structural damage requiring full replacement
- Major Missing cabinets in kitchen and bath — Structural damage requiring full replacement
- Major Debris on floor in kitchen and bath — Structural damage requiring full replacement
- Major Missing windows — Structural damage requiring full replacement
- Major Worn siding — Structural damage requiring full replacement
- Major Debris on ground — Structural damage requiring full replacement
Value-add opportunities
- Resale Replace exposed subfloor and cabinets in kitchen and bath — Improves the home's appearance and functionality, making it more attractive to potential buyers
- Resale Replace missing windows — Improves the home's appearance and functionality, making it more attractive to potential buyers
- Resale Paint and repair exterior siding — Improves the home's appearance and functionality, making it more attractive to potential buyers
- Rental Clean up debris — Improves the home's appearance and functionality, making it more attractive to potential renters
Renovation cost estimate screening
| Repair item | Severity | Est. cost |
|---|---|---|
| Exposed subfloor in kitchen and bath · Structural damage requiring full replacement | Major | $15,000–50,000 |
| Missing cabinets in kitchen and bath · Structural damage requiring full replacement | Major | $15,000–50,000 |
| Debris on floor in kitchen and bath · Structural damage requiring full replacement | Major | $15,000–50,000 |
| Missing windows · Structural damage requiring full replacement | Major | $15,000–50,000 |
| Worn siding · Structural damage requiring full replacement | Major | $15,000–50,000 |
| Debris on ground · Structural damage requiring full replacement | Major | $15,000–50,000 |
| Total estimated repair cost · 6 items | $90,000–300,000 |
Value-add ROI direction
- Resale Replace exposed subfloor and cabinets in kitchen and bath — Improves the home's appearance and functionality, making it more attractive to potential buyers ↑
- Resale Replace missing windows — Improves the home's appearance and functionality, making it more attractive to potential buyers ↑
- Resale Paint and repair exterior siding — Improves the home's appearance and functionality, making it more attractive to potential buyers ↑
- Rental Clean up debris — Improves the home's appearance and functionality, making it more attractive to potential renters ↑
ⓘ Cost ranges are severity-bucket heuristics (US national rule-of-thumb). Get contractor quotes + a written scope before underwriting a rehab budget.
Schools (NCES district)
- District
- Allegany County Public Schools
- NCES district ID
- 2400030
- Math proficiency
- 15% ▼ -26.00%
- Reading proficiency
- 30% ▼ -20.00%
- Median HH income
- $39,760
- Composite
- 18.95/100
- National rank
- #8854
- State rank
- #18 of 24 in MD
Livability — Eckhart Mines
- Score
- 56/100
- State rank
- #410
- US rank
- #22824
Category grades
Schools grade is shown separately in the Schools card above.
Census & demographics
- Population (ZIP)
- 13,123
Population outlook (Allegany County) Hauer SSP2
- Today (2025)
- 68,778 people
- By 2030
- 66,766 · -2.9%
- By 2040
- 62,784 · -8.7%
- By 2050
- 59,179 · -14.0%
- By 2075
- 50,732 · -26.2%
- By 2100
- 40,837 · -40.6%
Race, ethnicity, and origin ACS 2023
- Neighborhood character
- Predominantly White (89%)
- Race & ethnicity
- White 89% Black 6% Two or more races 2% Hispanic / Latino 2% Asian 2%
- Common ancestry
- Slovak 5% Romanian 2% Italian 1%
- Foreign-born
- 3% · Canada, China
- Languages at home
- 96% English-only · Spanish 2% Chinese 1%
Political lean MEDSL · Allegany
- 2024 margin
- Solid R (+40.3) · D 28.9% · R 69.2% · Other 2.0%
- 2008→2024 swing
- -14.4pp toward R · 2008: -25.9pp · 2024: -40.3pp
- All cycles
- 2024: R+40.3 2020: R+38.3 2016: R+48.0 2012: R+32.9 2008: R+25.9
Not yet ingested
- Civics
- —
Market trends
- HPI YoY
- ▼ -78.31%
- Current HPI
- 244.5937
- Rent YoY
- —
- Metro
- —
- State GDP YoY
- ▲ 2.97%
- F500 in state
- 12
Industry mix (Fortune 500 HQ in MD)
| Industry | F500 HQs | Revenue |
|---|---|---|
| Aerospace / Defense | 1 | $71B |
|
||
| Utilities | 1 | $25B |
|
||
| Hotels | 1 | $24B |
|
||
| Consumer Goods | 1 | $7B |
|
||
| Real Estate | 1 | $6B |
|
||
| Chemicals | 1 | $2B |
|
||
Price history
+0.0% since first listed2 events — show timeline
- 2026-03-30 Listed $38,000 BRIGHT MLS
- 2026-03-27 Coming Soon $38,000 BRIGHT MLS
Cash-flow waterfall
monthlySold comps — $/sqft
last 12 mo · ≤1 miLoading sold comps…