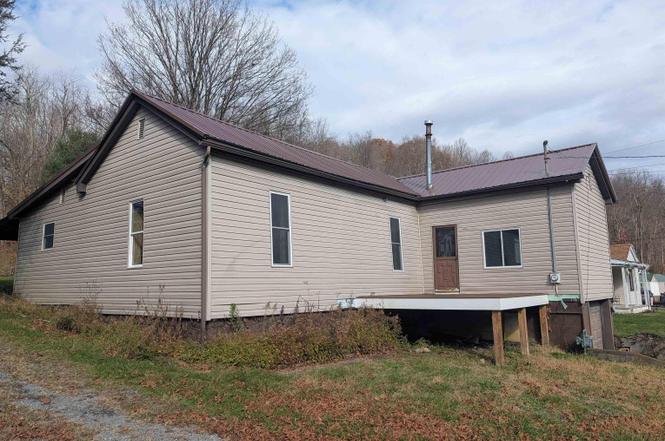
2340 George Washington Hwy · Grafton, WV
Flood risk 8/10 · Major
- FEMA flood zone
- X (unshaded)
- Chance of flooding over 30 yrs
- 0.99%
- Est. flood insurance / yr
- $473 – $860
Fire risk 2/10 · Minimal
- Est. fire insurance / yr
- $787 – $1,461
Heat risk 4/10 · Minor
- Hot days now (above 97°F)
- 7 days/yr
- Hot days in 30 yrs
- 20 days/yr
Wind risk 1/10 · Minimal
- Chance of severe wind over 30 yrs
- —
Air-quality risk 2/10 · Minimal
- Unhealthy air days now
- 0 days/yr
- Unhealthy air days in 30 yrs
- 1 days/yr
Risk factors via First Street. Map © Google.
Why this score? — see what drove the B grade
The composite is a weighted blend of 9 inputs, each scored 0–100. Each bar is that input's sub-score; the figure is the points it added to the 100-point composite (weight × sub-score).
- Cash flow +30.0/30.0
- DSCR +10.0/10.0
- 1% rule +9.5/10.0
- ARV discount +7.5/15.0
- Appreciation +5.7/10.0
- Livability +3.4/5.0
- Schools +2.7/10.0
- Rent growth +2.5/5.0
- Condition / age +2.5/5.0
$79,000
🖨 Deal sheet 📄 Offer letter ✓ Due diligence
Listing remarks MLS
Level lot along main Highway into Grafton. Could be commercial or residential. One level living. Garage in basement. Off street parking.
Key facts
- City water
- City sewage services
- Updated plumbing
Tags
Property features AI
Exterior
- Parking: Detached 2-car garage
- Utilities: Public sewer
- Home design: Single-family detached residence; One-story
- Construction: Frame construction; Vinyl siding; Wood siding; Metal roof
- Exterior features: Level lot
Interior
- Bathrooms: 2 full bathrooms
- Heating & cooling: No central heating listed
- Interior features: Crawl space basement; 8 total rooms
Neighborhood map
What this means for you Summary
Snapshot
- This is a 3-bed/1.5-bath single-family listed at $79k.
Deal economics
- At list price, monthly cash flow is $334 ($4k/yr) — positive.
- The deal already cash-flows at list — no discount required.
- Meets the 1% rule at list price ($1k rent vs $79k).
- Recommended offer: $70k (12.0% below list) — sets the bar for market timing.
- Cap rate 12.2% vs local median 4.1% in Grafton — top-decile yield for the area; either an underpriced asset or a hidden risk that comps aren't pricing in. Stress-test before assuming the spread holds.
Location & tenants
- Location reads 68/100 on livability (#85 in WV) — a middle-class / working-renter tenant base. Strengths: crime A+, cost of living A+, housing A+; Watch: health & safety C-, amenities F, commute F.
- Taylor County Schools (town): math 27% / reading 36% proficiency, ranked #22 of 55 in WV (top 40%) — families likely to look elsewhere, expect single-tenant / working-renter base with shorter leases.
- Zoned schools: West Taylor Elementary School (math 57% / reading 57%, grade C+, #23 of 377 statewide, top 7%, 283 students, 0% FRL); Taylor County Middle School (math 22% / reading 34%, grade F, #66 of 109 statewide, top 63%, 685 students, 0% FRL); Grafton High School (math 17% / reading 47%, grade F, #55 of 110 statewide, top 59%, 620 students, 0% FRL) — zoned schools average 0% FRL vs 44% district-wide (44 pts lower); this property's tenant base skews higher-income than the district average.
- Market conditions: 29 active listings in the ZIP.
Forward outlook
- In year one you build about $2k of equity ($546 loan paydown + $1k appreciation (1.4% local appreciation)).
- Taylor County population projected to shrink 7% by 2050 — rents likely to lag national; underwrite the cash flow, not the appreciation.
- At projected returns (1.4% appreciation + 3.0% rent growth), your $22k cash investment doubles in ~4 years — after that, you're playing with house money.
Negotiation context
- It's been on market 217 days — a 12% lower offer ($70k) is reasonable based on typical stale-listing flexibility.
- 2 sale attempts since 3y ago with the ask held roughly flat each time — persistent listings suggest the price (not the market) is what's stuck; bring a comps-based counter.
- Current owner paid $55k; 44% above their basis — modest negotiation headroom, anchor on the comps not their cost.
Risks & watch-outs
- Watch-outs: flood insurance adds $56/mo; built in 1930 — expect roof / HVAC / electrical / plumbing capex.
- Climate carrying-cost: severe flood risk — expect insurance premiums to compound above CPI over the hold.
Questions for the listing agent
- It's been on market 217 days. Have you received any prior offers? Is the seller open to a 12% concession, seller financing, or rate buy-down credit?
- Built in 1930 — when were the roof, HVAC, electrical panel, plumbing, and water heater last replaced?
- What's the actual annual flood-insurance premium (NFIP or private), and is the property in a SFHA with mandatory coverage?
- Why hasn't it sold? Are there any deal-killer items the seller is aware of (foundation, flood, title, zoning, code violations)?
- Is there a deadline driving the sale (1031 exchange, divorce, estate, relocation)? That informs how much negotiation room exists.
- Schools are F-rated, which usually means shorter tenancies and higher turnover. Who's the typical renter profile here, and what's been the actual vacancy rate?
- What's the average days-on-market for RENTAL listings here right now (not sales)? A rising rental-DOM trend means longer vacancies and softer asking-rent achievability than the comps imply.
- What's the recent tenant-quality profile in this submarket — average credit score on applications, eviction rate, late-payment / NSF rate, and stable-employment percentage? A property-management company in the area should have these aggregated.
- How much new for-sale + rental construction is in the pipeline within 1–3 miles? Heavy new supply typically softens prices + rents 12–24 months out; constrained supply supports both.
Investment metrics
- 1% rule
- 1.45% ✓
- Cap rate
- 12.21%
- Cash-on-cash
- 21.12%
- DSCR
- 1.94
- GRM
- 5.7
CMA / ARV
- ARV (on-the-fly)
- $184,888
- Comps found
- 2
Show comp detail 2 sales within ~0.75 mi
| Address | Dist | Beds/Ba | Sqft | Sold | Price | $/sf | Match |
|---|---|---|---|---|---|---|---|
| 73 Valley Fls | 0.14mi | 3/1.5 | 1,543 (+1%) | 19mo | $158,400 | $103 | 76 |
| 101 Haroldland Dr | 0.52mi | 3/2.0 | 1,424 (-7%) | 12mo | $172,500 | $121 | 52 |
Match score weights: distance 35% · size 25% · config 20% · recency 20%. Top-matched comps best support the ARV.
Projected returns pro-forma
1.44% appreciation · 3.0% rent growth · sell at horizon
- IRR
- 21.1%
- Equity multiple
- 2.11×
- Total profit
- $24,475
- Equity at exit
- $28,788
- IRR
- 23.7%
- Equity multiple
- 3.97×
- Total profit
- $65,798
- Equity at exit
- $39,704
Cash invested: $22,120 (down + closing). Projections, not guarantees.
Landlord ↔ Tenant lean methodology
- Overall (STATE)
- 83 Strongly Landlord-Friendly
- State West Virginia
- 83 Strongly Landlord-Friendly · R+22
- County
- — inherits STATE
- City
- — inherits STATE
ZIP-level market 26354
- Home prices YoY
- 0.6%
- Active inventory
- 29
- Price-to-rent
- 5.7×
Monthly cashflow live
- Estimated rent
- $1,148 medium interval (Pro) →
- Mortgage (P&I)
- −$414
- Tax from tax record
- −$70 /mo · $841/yr
- Insurance
- −$33
- Flood insurance flood zone
- −$56 /mo · $666/yr
- HOA
- −$0
- Vacancy / Maint / Mgmt
- −$241
- Net cashflow
- $334
Break-even live
UW: 25.0% down · 7.5% · 30yr · 1.5% tax · 5.0% vac · 8.0% maint · 8.0% mgmt
Financing live
Cash to close
- Down payment
- $19,750
- Closing costs
- $2,370
- Reserves months
- —
- Total cash needed
- —
Loan-product check · same deal, 3 products live
Conventional
25% down · 7.5% · 30yr
- Down + closing
- —
- Monthly P&I
- —
- Monthly cashflow
- —
- DSCR
- —
- Eligible?
- —
Personal DTI + credit; lowest rate.
DSCR
20% down · 8.5% · 30yr
- Down + closing
- —
- Monthly P&I
- —
- Monthly cashflow
- —
- DSCR
- —
- Eligible?
- —
No personal income docs; deal must DSCR.
Hard money
10% down · 12.0% · 12mo
- Down + closing
- —
- Monthly P&I
- —
- Monthly cashflow
- —
- DSCR
- —
- Eligible?
- —
Short-term bridge; refi at stabilization.
Listing history 20 events
-
2026-06-19days on market $79,000 Active 217 DOM
-
2026-06-18days on market $79,000 Active 216 DOM
-
2026-06-17days on market $79,000 Active 215 DOM
-
2026-06-16days on market $79,000 Active 214 DOM
-
2026-06-15days on market $79,000 Active 213 DOM
-
2026-06-14days on market $79,000 Active 211 DOM
-
2026-06-12days on market $79,000 Active 210 DOM
-
2026-06-09days on market $79,000 Active 207 DOM
-
2026-06-08days on market $79,000 Active 206 DOM
-
2026-06-07days on market $79,000 Active 205 DOM
-
2026-06-05days on market $79,000 Active 202 DOM
-
2026-06-02days on market $79,000 Active 200 DOM
-
2026-06-01days on market $79,000 Active 199 DOM
-
2026-05-31days on market $79,000 Active 198 DOM
-
2026-05-30days on market $79,000 Active 197 DOM
-
2025-11-15$79,000 Active
-
2023-04-21soldstatus $55,000 136-char remark
Show marketing remark (136 chars)
Level lot along main Highway into Grafton. Could be commercial or residential. One level living. Garage in basement. Off street parking.
-
2023-03-06$54,900 136-char remark
Show marketing remark (136 chars)
Level lot along main Highway into Grafton. Could be commercial or residential. One level living. Garage in basement. Off street parking.
-
2022-10-27soldstatus $97,424
-
2007-07-30soldstatus $84,000
ⓘ Source: listings_history table (triggers on properties + properties_extension) + one-shot
backfill from property_details.listing_events for pre-trigger history.
Tax reassessment forecast WV · Resets to sale price
- Current annual tax
- $841 · $70/mo
- Projected year-2 tax
- $841 · $70/mo
- Expected delta
- $0/yr ($0/mo · 0.0%)
ⓘ Screening estimate from a state-policy table — verify with the county assessor before closing.
Climate risk First Street
- Flood 8/10 Severe FEMA zone X (unshaded) · 99% chance over 30 yrs
- Wildfire 2/10 Low
- Heat 4/10 Moderate 7 d/yr ≥97°F today · 20 d/yr by 30 yrs out
- Wind 1/10 Low
- Air quality 2/10 Low 0 unhealthy d/yr today · 1 by 30 yrs out
Nearby sold comps map
Loading sold comps map…
Walkable amenities ~0.75 mi
Loading nearby amenities…
Taxation est. · year 1
- Rental income
- $13,771
- − Mortgage interest
- −$4,425
- − Property taxes
- −$841
- − Insurance
- −$1,062
- − Repairs & maintenance
- −$1,102
- − Management
- −$1,102
- − Depreciation
- −$2,298
- Taxable income
- $2,941
- Est. tax owed @ 24.0%
- −$706
- After-tax cash flow
- $3,299/yr
For passive investors: Depreciation is non-cash, so a rental often shows a tax loss while cash-flowing — sheltering income. Rental losses are passive: they offset passive income freely, and up to $25,000/yr can offset ordinary (W-2) income if you actively participate and your MAGI is under $100k (phasing out to $0 by $150k); unused losses carry forward. On sale, claimed depreciation is recaptured at up to 25%, and gains may owe capital-gains tax (a 1031 exchange can defer both). Figures are a year-1 estimate at your 24.0% rate — not tax advice; consult a CPA.
Schools (NCES district)
- District
- Taylor County Schools
- NCES district ID
- 5401380
- Math proficiency
- 27% ▼ -14.00%
- Reading proficiency
- 36% ▼ -11.00%
- Median HH income
- $41,369
- Composite
- 26.59/100
- National rank
- #7183
- State rank
- #22 of 55 in WV
Livability — Grafton
- Score
- 68/100
- State rank
- #85
- US rank
- #9831
Category grades
Schools grade is shown separately in the Schools card above.
Census & demographics
- Population (ZIP)
- 10,101
Population outlook (Taylor County) Hauer SSP2
- Today (2025)
- 16,987 people
- By 2030
- 16,923 · -0.4%
- By 2040
- 16,523 · -2.7%
- By 2050
- 15,802 · -7.0%
- By 2075
- 13,768 · -18.9%
- By 2100
- 10,464 · -38.4%
Race, ethnicity, and origin ACS 2023
- Neighborhood character
- Predominantly White (96%)
- Race & ethnicity
- White 96% Two or more races 2% Hispanic / Latino 1%
- Common ancestry
- Slovak 5% Serbian 3% Iranian 2%
- Foreign-born
- 0%
Political lean MEDSL · Taylor
- 2024 margin
- Solid R (+51.3) · D 23.3% · R 74.6% · Other 2.0%
- 2008→2024 swing
- -32.9pp toward R · 2008: -18.4pp · 2024: -51.3pp
- All cycles
- 2024: R+51.3 2020: R+49.9 2016: R+49.5 2012: R+32.2 2008: R+18.4
Not yet ingested
- Civics
- —
Market trends
- HPI YoY
- ▲ 1.44%
- Current HPI
- 229.6924
- Rent YoY
- —
- Metro
- —
- State GDP YoY
- —
- F500 in state
- 0
Price history
-6.0% since first listed5 events — show timeline
- 2025-11-15 Listed $79,000 NCWVREIN
- 2023-04-21 Sold (MLS) $55,000 NCWVREIN
- 2023-03-06 Listed $54,900 NCWVREIN
- 2022-10-27 Sold (Public Records) $97,424 Public Records
- 2007-07-30 Sold (Public Records) $84,000 Public Records
Property tax history
+7.5%/yrLatest (2025): $841 · +0.8% YoY. Source: county tax records.
Cash-flow waterfall
monthlySold comps — $/sqft
last 12 mo · ≤1 miLoading sold comps…