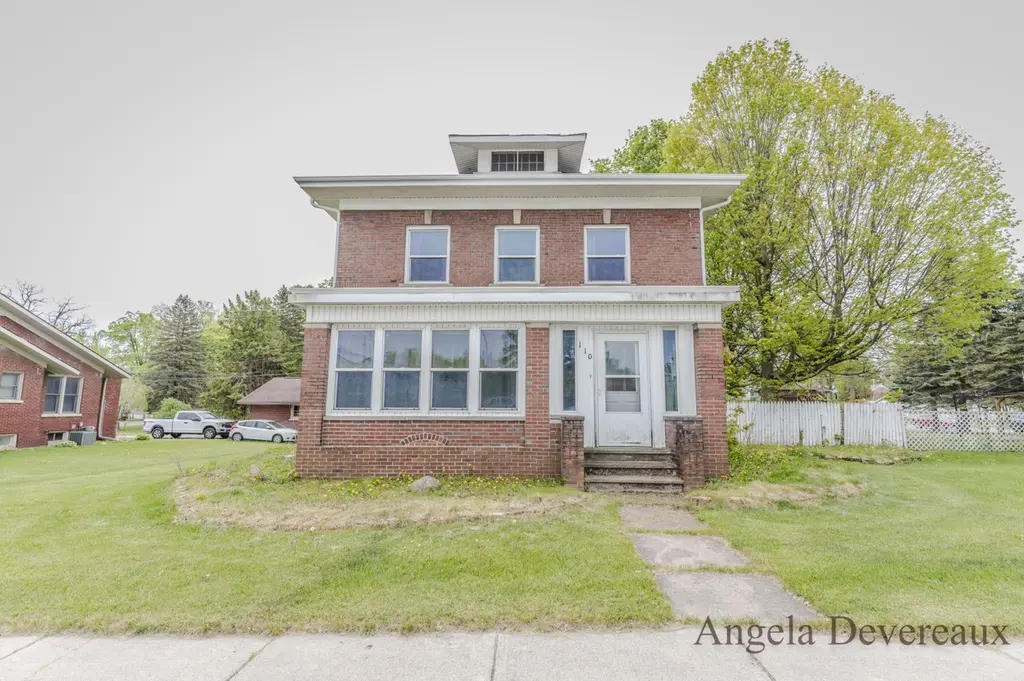
110 E Main St · Home, MI
Flood risk 1/10 · Minimal
- FEMA flood zone
- —
- Chance of flooding over 30 yrs
- 0.0%
- Est. flood insurance / yr
- —
Fire risk 1/10 · Minimal
- Est. fire insurance / yr
- $784 – $1,456
Heat risk 2/10 · Minimal
- Hot days now (above 96°F)
- 7 days/yr
- Hot days in 30 yrs
- 14 days/yr
Wind risk 1/10 · Minimal
- Chance of severe wind over 30 yrs
- —
Air-quality risk 2/10 · Minimal
- Unhealthy air days now
- 1 days/yr
- Unhealthy air days in 30 yrs
- 3 days/yr
Risk factors via First Street. Map © Google.
Why this score? — see what drove the F grade
The composite is a weighted blend of 9 inputs, each scored 0–100. Each bar is that input's sub-score; the figure is the points it added to the 100-point composite (weight × sub-score).
- Appreciation +10.0/10.0
- Cash flow +8.8/30.0
- 1% rule +2.7/10.0
- Rent growth +2.5/5.0
- Livability +2.5/5.0
- Condition / age +2.5/5.0
- DSCR +2.4/10.0
- Schools +2.4/10.0
- ARV discount +0.0/15.0
$175,000
🖨 Deal sheet (PDF) 📄 Offer letter ✓ Due diligence
Listing remarks MLS
Many updates have been made over the years to this wonderful home in the heart of Edmore! The home has some cool features to include 3 season rooms at the front and back of the home. Main floor features a very spacious living room, dining and kitchen with a half bath off the kitchen. The upstairs has 3 bedrooms and a full bath. The current owners have put in some fresh paint, new deck boards, counters, backsplash, sink, flooring in the kitchen, dining and the half bath. The new kitchen appliances also come with a 10-year warranty that is transferrable. There is also a OmniShield Fire system installed throughout the home and garage. Possession at the closing! Schedule your viewing today
Key facts
- Fresh paint
- 3 season rooms
- New deck boards
Tags
Property features AI
Exterior
- Parking: Detached 1-car garage; Parking available in the rear off the alley
- Utilities: Public water
- Home design: Victorian-style single-family home; Built in 1920; Residential property
- Construction: Brick construction; Built in 1920
- Exterior features: Brick exterior; Lot is about 0.23 acres; Public water
Interior
- Kitchen: Dishwasher; Range; Microwave; Refrigerator; Freezer
- Bathrooms: 1 full bathroom; 1 half bathroom
- Heating & cooling: Forced air heating; Central cooling
- Interior features: Fireplace; 10 total rooms; Full basement
- Laundry & utility: Washer; Dryer
Neighborhood map
What this means for you Summary
Snapshot
- This is a 3-bed/1.5-bath single-family listed at $175k.
Deal economics
- At list price, monthly cash flow is $-143 ($-2k/yr) — negative.
- To cash-flow at today's rent, offer at most $154k (11.8% below list).
- To meet the 1% rule (rent ≥ 1% of price), the offer needs to be $135k (22.9% below list).
- Recommended offer: $135k (22.9% below list) — sets the bar for 1% rule.
Location & tenants
- Location reads: area grade F — affects rentability + tenant quality, not the cash-flow math above.
- Montabella Community Schools (rural): math 20% / reading 36% proficiency, ranked #396 of 540 in MI (top 73%) — low school quality limits family demand, transient renter base, plan for 1-2y turnover.
- Zoned schools: Montabella Elementary (math 21% / reading 30%, grade F, #974 of 1,397 statewide, top 70%, 363 students, 71% FRL); Montabella Juniorsenior High (math 17% / reading 42%, grade F, #441 of 713 statewide, top 64%, 382 students, 63% FRL).
- Market conditions: 18 active listings in the ZIP; 1 comparable units currently listed for rent nearby; 273 units permitted in Montcalm County in 2024 (5 in 5+ unit buildings).
Forward outlook
- In year one you build about $19k of equity ($1k loan paydown + $18k appreciation (10.0% local appreciation)).
- Montcalm County population projected at -17% by 2050 — secular population decline; favor cash flow + early exit over multi-decade hold.
- By year 2, paydown + projected appreciation supports a ~$30k cash-out refi (75% LTV) — recoverable capital for the next deal without selling this one.
Negotiation context
- It's been on market 33 days — a 3% lower offer ($170k) is reasonable based on typical stale-listing flexibility.
- 10 sale attempts since 15y ago; this cycle's ask has dropped $10k (5%) from the opening price — seller is motivated, your offer sets the floor, not the list.
- Current owner paid $80k; list at $175k implies a 119% gain — meaningful room to come down on a strong offer.
Risks & watch-outs
- Watch-outs: built in 1920 — expect roof / HVAC / electrical / plumbing capex.
Questions for the listing agent
- What do current leases actually rent for vs. the listed asking? Can we see a recent rent roll and the last 12 months of T-12 income?
- It's been on market 33 days. Have you received any prior offers? Is the seller open to a 23% concession, seller financing, or rate buy-down credit?
- Built in 1920 — when were the roof, HVAC, electrical panel, plumbing, and water heater last replaced?
- Is there a deadline driving the sale (1031 exchange, divorce, estate, relocation)? That informs how much negotiation room exists.
- The area grade is low — what's the realistic commute time and amenity access for the typical tenant pool here? Any planned neighborhood developments (good or bad) we should know about?
- What's the average days-on-market for RENTAL listings here right now (not sales)? A rising rental-DOM trend means longer vacancies and softer asking-rent achievability than the comps imply.
- What's the recent tenant-quality profile in this submarket — average credit score on applications, eviction rate, late-payment / NSF rate, and stable-employment percentage? A property-management company in the area should have these aggregated.
- How much new for-sale + rental construction is in the pipeline within 1–3 miles? Heavy new supply typically softens prices + rents 12–24 months out; constrained supply supports both.
Investment metrics
- 1% rule
- 0.77% ✗
- Cap rate
- 5.31%
- Cash-on-cash
- -3.50%
- DSCR
- 0.84
- GRM
- 10.8
CMA / ARV
- ARV (on-the-fly)
- $141,100
- Comps found
- 9
Show comp detail 9 sales within ~0.75 mi
| Address | Dist | Beds/Ba | Sqft | Sold | Price | $/sf | Match |
|---|---|---|---|---|---|---|---|
| 312 S Brown St | 0.18mi | 3/2.0 | 1,688 (-1%) | 4mo | $52,501 | $31 | 85 |
| 305 S 1st St | 0.14mi | 3/2.0 | 1,818 (+7%) | 2mo | $189,000 | $104 | 78 |
| 126 N 2nd St | 0.09mi | 3/2.0 | 1,800 (+6%) | 10mo | $90,000 | $50 | 76 |
| 320 N 2nd St Lot : 38,39 | 0.21mi | 3/2.0 | 1,620 (-5%) | 15mo | $65,000 | $40 | 68 |
| 320 N 2nd St | 0.21mi | 3/2.0 | 1,620 (-5%) | 15mo | $65,000 | $40 | 68 |
| 124 N 5th St | 0.25mi | 4/2.0 (+1) | 1,800 (+6%) | 8mo | $150,000 | $83 | 65 |
| 503 W Gilson St | 0.30mi | 4/2.5 (+1) | 1,823 (+7%) | 3mo | $257,000 | $141 | 63 |
| 305 W Forest St | 0.27mi | 4/1.0 (+1) | 1,576 (-7%) | 20mo | $185,000 | $117 | 52 |
| 201 Center St | 0.67mi | 2/1.0 (-1) | 1,592 (-6%) | 13mo | $249,900 | $157 | 40 |
Match score weights: distance 35% · size 25% · config 20% · recency 20%. Top-matched comps best support the ARV.
Projected returns pro-forma
10.0% appreciation · 3.0% rent growth · sell at horizon
- IRR
- 21.8%
- Equity multiple
- 2.76×
- Total profit
- $86,230
- Equity at exit
- $157,654
- IRR
- 19.6%
- Equity multiple
- 6.33×
- Total profit
- $261,129
- Equity at exit
- $339,987
Cash invested: $49,000 (down + closing). Projections, not guarantees.
Landlord ↔ Tenant lean methodology
- Overall (STATE)
- 62 Landlord-Friendly
- State Michigan
- 62 Landlord-Friendly · EVEN
- County
- — inherits STATE
- City
- — inherits STATE
ZIP-level market 48829
- Home prices YoY
- 3.6%
- Active inventory
- 18
- Price-to-rent
- 10.8×
Monthly cashflow live
- Estimated rent
- $1,350 medium interval (Pro) →
- Mortgage (P&I)
- −$918
- Tax est. 1.5%
- −$219 /mo · $2,625/yr
- Insurance
- −$73
- HOA
- −$0
- Vacancy / Maint / Mgmt
- −$284
- Net cashflow
- $-143
Break-even live
Sensitivity live
| Price | -10% $-22 | -5% $-82 | +0% $-143 | +5% $-203 | +10% $-264 |
|---|---|---|---|---|---|
| Rent | -10% $-250 | -5% $-196 | +0% $-143 | +5% $-90 | +10% $-36 |
| Rate | -1.0pp $-55 | -0.5pp $-98 | base $-143 | +0.5pp $-188 | +1.0pp $-234 |
UW: 25.0% down · 7.5% · 30yr · 1.5% tax · 5.0% vac · 8.0% maint · 8.0% mgmt
Financing live
Cash to close
- Down payment
- $43,750
- Closing costs
- $5,250
- Reserves months
- —
- Total cash needed
- —
Loan-product check · same deal, 3 products live
Conventional
25% down · 7.5% · 30yr
- Down + closing
- —
- Monthly P&I
- —
- Monthly cashflow
- —
- DSCR
- —
- Eligible?
- —
Personal DTI + credit; lowest rate.
DSCR
20% down · 8.5% · 30yr
- Down + closing
- —
- Monthly P&I
- —
- Monthly cashflow
- —
- DSCR
- —
- Eligible?
- —
No personal income docs; deal must DSCR.
Hard money
10% down · 12.0% · 12mo
- Down + closing
- —
- Monthly P&I
- —
- Monthly cashflow
- —
- DSCR
- —
- Eligible?
- —
Short-term bridge; refi at stabilization.
Rent comps 1 comps
| Address | Beds | Baths | Sqft | Rent | $/sqft | DOM | Units | Dist |
|---|---|---|---|---|---|---|---|---|
| 1260 E Main St Apt 21 Edmore, MI | 3.0 | 1.0 | 1275 | $1,350 | $1.06 | 22d | 1 | 0.78mi |
Listing history 46 events
-
2026-06-21status $175,000 Pending 33 DOM
-
2026-06-19days on market $175,000 Active 33 DOM
-
2026-06-18days on market $175,000 Active 32 DOM
-
2026-06-17days on market $175,000 Active 31 DOM
-
2026-06-16days on market $175,000 Active 30 DOM
-
2026-06-15days on market $175,000 Active 29 DOM
-
2026-06-14days on market $175,000 Active 27 DOM
-
2026-06-12days on market $175,000 Active 26 DOM
-
2026-06-09days on market $175,000 Active 23 DOM
-
2026-06-08days on market $175,000 Active 22 DOM
-
2026-06-07days on market $175,000 Active 21 DOM
-
2026-06-05pricedays on market $175,000 Active 18 DOM
-
2026-06-03days on market $185,000 Active 17 DOM
-
2026-06-02days on market $185,000 Active 16 DOM
-
2026-06-01days on market $185,000 Active 15 DOM
-
2026-05-31days on market $185,000 Active 14 DOM
-
2026-05-30days on market $185,000 Active 13 DOM
-
2026-05-17$185,000 Active 694-char remark
Show marketing remark (694 chars)
Many updates have been made over the years to this wonderful home in the heart of Edmore! The home has some cool features to include 3 season rooms at the front and back of the home. Main floor features a very spacious living room, dining and kitchen with a half bath off the kitchen. The upstairs has 3 bedrooms and a full bath. The current owners have put in some fresh paint, new deck boards, counters, backsplash, sink, flooring in the kitchen, dining and the half bath. The new kitchen appliances also come with a 10-year warranty that is transferrable. There is also a OmniShield Fire system installed throughout the home and garage. Possession at the closing! Schedule your viewing today
-
2026-05-17$185,000 Active
Show marketing remark (694 chars)
Many updates have been made over the years to this wonderful home in the heart of Edmore! The home has some cool features to include 3 season rooms at the front and back of the home. Main floor features a very spacious living room, dining and kitchen with a half bath off the kitchen. The upstairs has 3 bedrooms and a full bath. The current owners have put in some fresh paint, new deck boards, counters, backsplash, sink, flooring in the kitchen, dining and the half bath. The new kitchen appliances also come with a 10-year warranty that is transferrable. There is also a OmniShield Fire system installed throughout the home and garage. Possession at the closing! Schedule your viewing today
-
2023-05-03soldstatus $80,000
-
2021-02-04soldstatus $99,900
-
2021-01-27soldstatus $99,900 Sold
-
2021-01-27soldstatus $99,900 Sold
-
2021-01-27soldstatus $99,900
-
2021-01-08status Pending
-
2021-01-08status Pending
-
2021-01-08historical Accepting Backup Offers
-
2020-12-19historical Active Backup
-
2020-12-18price $99,900
-
2020-12-10price $110,900
-
2020-12-07price $115,900
-
2020-12-03price $119,900
-
2020-12-03status Active
-
2020-11-04status Pending
-
2020-10-29historical Active Backup
-
2020-10-15price $99,900
-
2020-10-08$99,900 Active
-
2020-10-08$119,900 Active
-
2020-10-08$99,900
-
2011-06-15soldstatus $31,000
-
2011-06-15soldstatus $31,000
-
2011-06-01$34,500
-
2011-06-01$34,500
-
2011-04-18$34,500
-
2002-07-11soldstatus $76,000
ⓘ Source: listings_history table (triggers on properties + properties_extension) + one-shot
backfill from property_details.listing_events for pre-trigger history.
Climate risk First Street
- Flood 1/10 Low 0% chance over 30 yrs
- Wildfire 1/10 Low
- Heat 2/10 Low 7 d/yr ≥96°F today · 14 d/yr by 30 yrs out
- Wind 1/10 Low
- Air quality 2/10 Low 1 unhealthy d/yr today · 3 by 30 yrs out
Nearby sold comps map
Loading sold comps map…
Walkable amenities ~0.75 mi
Loading nearby amenities…
Taxation est. · year 1
- Rental income
- $16,200
- − Mortgage interest
- −$9,803
- − Property taxes
- −$2,625
- − Insurance
- −$875
- − Repairs & maintenance
- −$1,296
- − Management
- −$1,296
- − Depreciation
- −$5,091
- Taxable loss
- −$4,786
- Est. tax savings @ 24.0%
- +$1,149
- After-tax cash flow
- $-566/yr
For passive investors: Depreciation is non-cash, so a rental often shows a tax loss while cash-flowing — sheltering income. Rental losses are passive: they offset passive income freely, and up to $25,000/yr can offset ordinary (W-2) income if you actively participate and your MAGI is under $100k (phasing out to $0 by $150k); unused losses carry forward. On sale, claimed depreciation is recaptured at up to 25%, and gains may owe capital-gains tax (a 1031 exchange can defer both). Figures are a year-1 estimate at your 24.0% rate — not tax advice; consult a CPA.
Schools (NCES district)
- District
- Montabella Community Schools
- NCES district ID
- 2612960
- Math proficiency
- 20% ▼ -6.00%
- Reading proficiency
- 36% ▼ -6.00%
- Median HH income
- $39,806
- Composite
- 23.51/100
- National rank
- #7867
- State rank
- #396 of 540 in MI
Livability — Home
No livability data for this city. (Only ~50 U.S. cities are tracked.)
Census & demographics
- Census place
- Edmore, MI
- Population (ZIP)
- 3,461
Population outlook (Montcalm County) Hauer SSP2
- Today (2025)
- 61,011 people
- By 2030
- 59,467 · -2.5%
- By 2040
- 55,427 · -9.2%
- By 2050
- 50,517 · -17.2%
- By 2075
- 38,731 · -36.5%
- By 2100
- 26,770 · -56.1%
Race, ethnicity, and origin ACS 2023
- Neighborhood character
- Predominantly White (93%)
- Race & ethnicity
- White 93% Two or more races 4% Hispanic / Latino 3%
- Common ancestry
- Iranian 4% Romanian 3% Lithuanian 2%
- Foreign-born
- 2% · Canada
- Languages at home
- 94% English-only · Spanish 4% Arabic 1% French/Haitian/Cajun 0%
Political lean MEDSL · Montcalm
- 2024 margin
- Solid R (+39.0) · D 29.8% · R 68.7% · Other 1.5%
- 2008→2024 swing
- -38.7pp toward R · 2008: -0.3pp · 2024: -39.0pp
- All cycles
- 2024: R+39.0 2020: R+37.7 2016: R+34.0 2012: R+8.6 2008: R+0.3
Not yet ingested
- Civics
- —
Market trends
- HPI YoY
- ▲ 11.78%
- Current HPI
- 335.1335
- Rent YoY
- —
- Metro
- —
- State GDP YoY
- ▲ 1.37%
- F500 in state
- 28
Industry mix (Fortune 500 HQ in MI)
| Industry | F500 HQs | Revenue |
|---|---|---|
| Automotive Parts | 3 | $48B |
|
||
| Automotive | 2 | $372B |
|
||
| Chemicals | 1 | $45B |
|
||
| Automotive Retail | 1 | $29B |
|
||
| Healthcare / Medical Devices | 1 | $23B |
|
||
| Automotive Technology | 1 | $20B |
|
||
Price history
+143.4% since first listed29 events — show timeline
- 2026-05-17 Listed $185,000 REALCOMP
- 2026-05-17 Listed $185,000 SW Michigan MLS
- 2026-05-17 Listed $185,000 MiRealSource-MiMLS
- 2023-05-03 Sold (Public Records) $80,000 Public Records
- 2021-02-04 Sold (Public Records) $99,900 Public Records
- 2021-01-27 Sold (MLS) $99,900 MiRealSource-MiMLS
- 2021-01-27 Sold (MLS) $99,900 SW Michigan MLS
- 2021-01-27 Sold (MLS) $99,900 REALCOMP
- 2021-01-08 Pending — REALCOMP
- 2021-01-08 Pending — SW Michigan MLS
- 2021-01-08 Contingent — REALCOMP
- 2020-12-19 Contingent — SW Michigan MLS
- 2020-12-18 Price Changed $99,900 SW Michigan MLS
- 2020-12-10 Price Changed $110,900 SW Michigan MLS
- 2020-12-07 Price Changed $115,900 SW Michigan MLS
- 2020-12-03 Price Changed $119,900 SW Michigan MLS
- 2020-12-03 Relisted — SW Michigan MLS
- 2020-11-04 Pending — SW Michigan MLS
- 2020-10-29 Contingent — SW Michigan MLS
- 2020-10-15 Price Changed $99,900 SW Michigan MLS
- 2020-10-08 Listed $99,900 MiRealSource-MiMLS
- 2020-10-08 Listed $119,900 SW Michigan MLS
- 2020-10-08 Listed $99,900 REALCOMP
- 2011-06-15 Sold (MLS) $31,000 REALCOMP
- 2011-06-15 Sold (MLS) $31,000 SW Michigan MLS
- 2011-06-01 Listed $34,500 REALCOMP
- 2011-06-01 Listed $34,500 SW Michigan MLS
- 2011-04-18 Listed $34,500 MiRealSource-MiMLS
- 2002-07-11 Sold (Public Records) $76,000 Public Records
Cash-flow waterfall
monthlySold comps — $/sqft
last 12 mo · ≤1 miLoading sold comps…