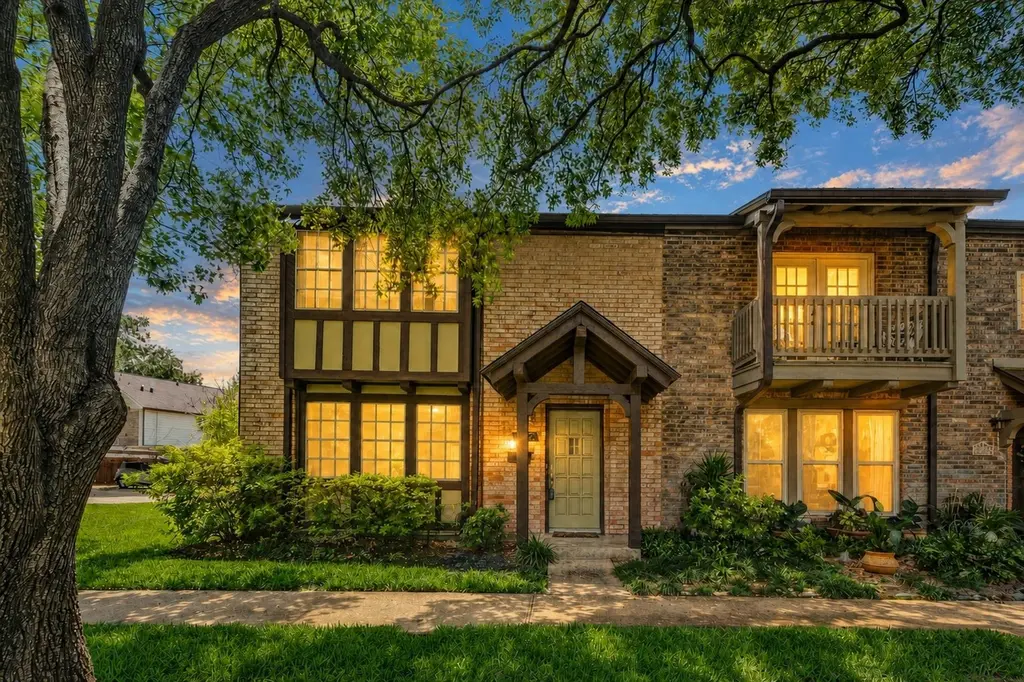
2267 Triway Ln #231 · Houston, TX
Flood risk 1/10 · Minimal
- FEMA flood zone
- X (unshaded)
- Chance of flooding over 30 yrs
- 0.0%
- Est. flood insurance / yr
- $507 – $1,088
Fire risk 1/10 · Minimal
- Est. fire insurance / yr
- $1,222 – $2,270
Heat risk 9/10 · Severe
- Hot days now (above 109°F)
- 7 days/yr
- Hot days in 30 yrs
- 21 days/yr
Wind risk 9/10 · Severe
- Chance of severe wind over 30 yrs
- 99.0%
Air-quality risk 3/10 · Minor
- Unhealthy air days now
- 2 days/yr
- Unhealthy air days in 30 yrs
- 3 days/yr
Risk factors via First Street. Map © Google.
Why this score? — see what drove the D grade
The composite is a weighted blend of 9 inputs, each scored 0–100. Each bar is that input's sub-score; the figure is the points it added to the 100-point composite (weight × sub-score).
- ARV discount +15.0/15.0
- Cash flow +7.7/30.0
- 1% rule +6.3/10.0
- Schools +4.1/10.0
- Livability +3.7/5.0
- Condition / age +2.5/5.0
- Rent growth +2.3/5.0
- DSCR +1.8/10.0
- Appreciation +0.0/10.0
$168,500
🖨 Deal sheet (PDF) 📄 Offer letter ✓ Due diligence
Listing remarks MLS
Fabulous Corner Lot Town-Home In The Spring Branch Area, This Home Features Lots Of Natural Lighting Throughout, Charming Kitchen And Spacious Rooms To Enjoy And Entertain Your Family & Friends. Sits Right At The Corner to Community Pool, Park/Playground And Basketball Court. Completely Renovated in 2019 With Paint Throughout, Tile Floors, And Carpet In Bedrooms. Outside Patio Includes Shed And Some Gardening Space, All Bedrooms Up, Conveniently Located Nearby HEB, Memorial City Mall, Town & Country Village, I-10, Beltway 8 And Highway 290. Great Restaurants. The Community Offers Tennis, Pool, Basketball, Play yard, Swimming Pool And Lots Of Nearby Things To Do. Schedule Your Tour Today!
Key facts
- Designer kitchen
- Peaceful park
- Easy access
Tags
Property features AI
Finance
- Financial info: Lease considered
- HOA & community: Community managed by RANDALL MANAGEMENT; Monthly association fee of $340; HOA includes clubhouse, common areas, insurance, recreation facilities, sewer and water; Community pool
Exterior
- Parking: Attached carport; 2-car carport
- Security: Smoke detector(s)
- Utilities: Public water; Public sewer
- Home design: Residential property; 2 stories; Built in 1969; Slab foundation; Composition roof
- Construction: Brick construction
- Exterior features: Deck; Patio
Interior
- Kitchen: Electric range; Oven; Dishwasher; Disposal
- Bedrooms: 3 total rooms
- Flooring: Carpet; Laminate
- Bathrooms: 2 full bathrooms; 1 half bathroom
- Heating & cooling: Central heating (gas); Central electric air conditioning; Programmable thermostat
- Interior features: Double vanity; Kitchen and family room combo; Pantry; Tub with shower; Window treatments / coverings; Ceiling fan(s); Programmable thermostat
- Laundry & utility: Laundry in utility room; Gas dryer hookup; Washer; Dryer
Neighborhood map
What this means for you Summary
Snapshot
- This is a 3-bed/2.5-bath townhouse listed at $168k.
Deal economics
- At list price, monthly cash flow is $-196 ($-2k/yr) — negative.
- To cash-flow at today's rent, offer at most $134k (20.5% below list).
- Meets the 1% rule at list price ($2k rent vs $168k).
- Recommended offer: $134k (20.5% below list) — sets the bar for cash-flow.
- Cap rate 4.9% vs local median 3.2% in Houston — top-decile yield for the area; either an underpriced asset or a hidden risk that comps aren't pricing in. Stress-test before assuming the spread holds.
Location & tenants
- Location reads 74/100 on livability (#184 in TX, #4,771 nationally) — a middle-class / working-renter tenant base. Strengths: amenities A+, cost of living A+, housing A+; Watch: crime F.
- Spring Branch ISD (urban): math 47% / reading 46% proficiency, ranked #215 of 826 in TX (top 26%) — families likely to look elsewhere, expect single-tenant / working-renter base with shorter leases.
- Zoned schools: Westwood El (math 20% / reading 20%, grade F, #3,536 of 4,322 statewide, top 83%, 409 students, 93% FRL); Spring Oaks Middle (math 22% / reading 30%, grade F, #1,222 of 1,662 statewide, top 74%, 644 students, 91% FRL); Spring Woods H S (math 53% / reading 36%, grade F, #652 of 1,632 statewide, top 43%, 2,113 students, 82% FRL) — zoned schools average 89% FRL vs 54% district-wide (35 pts higher); higher-poverty schools than district average — tighter screening recommended.
- Zoned-school proficiency averages 30% at this address vs 46% district-wide (-16 pts) — the specific schools serving this property underperform the Spring Branch ISD average; the district grade overstates school quality for this exact location.
- Market conditions: Rents soft (-0.9%/yr); 202 active listings in the ZIP; 28 comparable units currently listed for rent nearby; rentals lingering (median 46d on market — plan ~5-8 weeks vacancy on turnover, expect pricing pressure); 61% of comp listings sitting > 30 days — soft ceiling on asking rent; solid renter incomes; 29,883 units permitted in Harris County in 2024 (8,621 in 5+ unit buildings).
Forward outlook
- Local home prices are declining (-3.0%/yr); year-one equity from $1k of loan paydown is wiped out by about $5k of value loss. Plan a longer hold.
- Harris County population projected at +47% by 2050 — long-run rental-demand tailwind backs the buy-and-hold thesis.
Negotiation context
- It's been on market 28 days — a 2% lower offer ($166k) is reasonable based on typical stale-listing flexibility.
- 7 sale attempts since 7y ago with the ask held roughly flat each time — persistent listings suggest the price (not the market) is what's stuck; bring a comps-based counter.
Risks & watch-outs
- Watch-outs: property tax is 2.9% of price.
- Climate carrying-cost: severe wind risk, 99% chance of damaging wind over 30y; extreme-heat days projected 7→21/yr by 2055 (HVAC capex compounding) — expect insurance premiums to compound above CPI over the hold.
Questions for the listing agent
- What do current leases actually rent for vs. the listed asking? Can we see a recent rent roll and the last 12 months of T-12 income?
- Built in 1969 — when were the roof, HVAC, electrical panel, plumbing, and water heater last replaced?
- Property tax is high relative to price — has the assessment been appealed recently, and will the sale trigger a re-assessment?
- What does the HOA fee cover, when was the last increase, and are there any pending special assessments or reserve-fund shortfalls?
- Is there a deadline driving the sale (1031 exchange, divorce, estate, relocation)? That informs how much negotiation room exists.
- Schools are D-rated, which usually means shorter tenancies and higher turnover. Who's the typical renter profile here, and what's been the actual vacancy rate?
- Crime grade is F in this area — have there been break-ins, vandalism, or insurance claims at this property in the last 3 years? What carrier currently insures it and at what premium?
- The area grade is low — what's the realistic commute time and amenity access for the typical tenant pool here? Any planned neighborhood developments (good or bad) we should know about?
- What's the average days-on-market for RENTAL listings here right now (not sales)? A rising rental-DOM trend means longer vacancies and softer asking-rent achievability than the comps imply.
- What's the recent tenant-quality profile in this submarket — average credit score on applications, eviction rate, late-payment / NSF rate, and stable-employment percentage? A property-management company in the area should have these aggregated.
- How much new for-sale + rental construction is in the pipeline within 1–3 miles? Heavy new supply typically softens prices + rents 12–24 months out; constrained supply supports both.
Investment metrics
- 1% rule
- 1.13% ✓
- Cap rate
- 4.90%
- Cash-on-cash
- -4.98%
- DSCR
- 0.78
- GRM
- 7.4
CMA / ARV
- ARV (median comp)
- $204,128
- List price
- $168,500
- Delta
- -17.45%
- Verdict
- UNDERPRICED
- Comps
- 20 within 1.0 mi
Show comp detail 12 sales within ~0.75 mi
| Address | Dist | Beds/Ba | Sqft | Sold | Price | $/sf | Match |
|---|---|---|---|---|---|---|---|
| 2247 Triway Ln #238 | 0.02mi | 3/3.0 | 1,900 (+7%) | 13mo | $226,900 | $119 | 75 |
| 2212 Shadowdale Dr #358 | 0.13mi | 3/2.5 | 1,964 (+11%) | 2mo | $170,000 | $87 | 75 |
| 10416 Hammerly Blvd #45 | 0.21mi | 3/2.5 | 1,846 (+4%) | 12mo | $219,900 | $119 | 73 |
| 10520 Hammerly Blvd #249 | 0.06mi | 3/2.5 | 1,986 (+12%) | 5mo | $169,000 | $85 | 73 |
| 2246 Triway Ln | 0.19mi | 4/2.5 (+1) | 1,716 (-3%) | 10mo | $219,900 | $128 | 72 |
| 2263 Triway Ln | 0.01mi | 3/2.5 | 1,976 (+11%) | 11mo | $205,000 | $104 | 72 |
| 2244 Triway Ln #109 | 0.17mi | 3/2.5 | 1,584 (-11%) | 3mo | $185,000 | $117 | 72 |
| 2233 Triway Ln #267 | 0.06mi | 3/2.5 | 1,986 (+12%) | 8mo | $179,000 | $90 | 71 |
| 2206 Shadowdale Dr #355 | 0.14mi | 3/2.5 | 1,964 (+11%) | 9mo | $210,000 | $107 | 68 |
| 10320 Hammerly Blvd #171 | 0.31mi | 3/2.5 | 1,656 (-7%) | 10mo | $188,000 | $114 | 66 |
| 2202 Shadowdale Dr | 0.15mi | 3/2.5 | 2,039 (+15%) | 3mo | $194,000 | $95 | 66 |
| 10358 Hammerly Blvd #18 | 0.29mi | 3/2.5 | 1,518 (-14%) | 1mo | $195,000 | $128 | 61 |
Match score weights: distance 35% · size 25% · config 20% · recency 20%. Top-matched comps best support the ARV.
Projected returns pro-forma
-3.0% appreciation · 0.0% rent growth · sell at horizon
- IRR
- -29.8%
- Equity multiple
- 0.05×
- Total profit
- $-45,002
- Equity at exit
- $25,124
- IRR
- -65.2%
- Equity multiple
- -0.60×
- Total profit
- $-75,390
- Equity at exit
- $14,569
Cash invested: $47,180 (down + closing). Projections, not guarantees.
Landlord ↔ Tenant lean methodology
- Overall (STATE)
- 87 Strongly Landlord-Friendly
- State Texas
- 87 Strongly Landlord-Friendly · R+5
- County
- — inherits STATE
- City
- — inherits STATE
ZIP-level market 77043
- Rents YoY
- -0.9%
- Active inventory
- 202
- Price-to-rent
- 7.4×
Monthly cashflow live
- Estimated rent
- $1,909 high interval (Pro) →
- Mortgage (P&I)
- −$884
- Tax from tax record
- −$410 /mo · $4,915/yr
- Insurance
- −$70
- HOA
- −$340
- Vacancy / Maint / Mgmt
- −$401
- Net cashflow
- $-196
Break-even live
Sensitivity live
| Price | -10% $-100 | -5% $-148 | +0% $-196 | +5% $-243 | +10% $-291 |
|---|---|---|---|---|---|
| Rent | -10% $-346 | -5% $-271 | +0% $-196 | +5% $-120 | +10% $-45 |
| Rate | -1.0pp $-111 | -0.5pp $-153 | base $-196 | +0.5pp $-239 | +1.0pp $-284 |
UW: 25.0% down · 7.5% · 30yr · 1.5% tax · 5.0% vac · 8.0% maint · 8.0% mgmt
Financing live
Cash to close
- Down payment
- $42,125
- Closing costs
- $5,055
- Reserves months
- —
- Total cash needed
- —
Loan-product check · same deal, 3 products live
Conventional
25% down · 7.5% · 30yr
- Down + closing
- —
- Monthly P&I
- —
- Monthly cashflow
- —
- DSCR
- —
- Eligible?
- —
Personal DTI + credit; lowest rate.
DSCR
20% down · 8.5% · 30yr
- Down + closing
- —
- Monthly P&I
- —
- Monthly cashflow
- —
- DSCR
- —
- Eligible?
- —
No personal income docs; deal must DSCR.
Hard money
10% down · 12.0% · 12mo
- Down + closing
- —
- Monthly P&I
- —
- Monthly cashflow
- —
- DSCR
- —
- Eligible?
- —
Short-term bridge; refi at stabilization.
Rent comps 28 comps
| Address | Beds | Baths | Sqft | Rent | $/sqft | DOM | Units | Dist |
|---|---|---|---|---|---|---|---|---|
| 2226 Triway Ln #100 Houston, TX | 3.0 | 2.5 | 1584 | $1,900 | $1.20 | 45d | 1 | 0.14mi |
| 10580 Hammerly Blvd Houston, TX | 1.0–4.0 | 1.0–2.5 | 987 | $1,367 | $1.38 | 0d | 30 | 0.22mi |
| 10386 Hammerly Blvd Houston, TX | 3.0 | 3.0 | 1716 | $1,950 | $1.14 | 45d | 1 | 0.26mi |
| 2823 Stetson Ln Houston, TX | 4.0 | 2.0 | 2050 | $3,050 | $1.49 | 45d | 1 | 0.72mi |
| 10105 Kempwood Dr Houston, TX | 1.0–3.0 | 1.0–2.0 | 925 | $1,575 | $1.70 | 4d | 24 | 0.87mi |
| 10214 Londonderry Dr Houston, TX | 3.0 | 2.0 | 1606 | $2,600 | $1.62 | 45d | 1 | 0.91mi |
| 10221 Centrepark Dr Unit 525 Houston, TX | 3.0 | 2.0 | 1386 | $2,039 | $1.47 | 0d | 1 | 1.10mi |
| 10221 Centrepark Dr Unit 10254 Houston, TX | 3.0 | 2.0 | 1386 | $2,014 | $1.45 | 45d | 1 | 1.10mi |
| 10221 Centrepark Dr Unit 3174 Houston, TX | 3.0 | 2.0 | 1386 | $2,090 | $1.51 | 13d | 1 | 1.10mi |
| 10829 Hammerly Blvd Houston, TX | 2.0 | 2.0 | 1226 | $2,064 | $1.68 | 26d | 1 | 1.11mi |
| 3125 Crestdale Dr Unit 1064 Houston, TX | 3.0 | 2.0 | 1400 | $1,399 | $1.00 | 45d | 1 | 1.18mi |
| 3125 Crestdale Dr Unit 1006 Houston, TX | 3.0 | 2.0 | 1495 | $1,629 | $1.09 | 26d | 1 | 1.18mi |
| 3125 Crestdale Dr Unit 1057 Houston, TX | 3.0 | 2.0 | 1241 | $1,419 | $1.14 | 45d | 1 | 1.18mi |
| 3125 Crestdale Dr Unit 1436 Houston, TX | 3.0 | 2.0 | 1450 | $1,599 | $1.10 | 45d | 1 | 1.18mi |
| 3125 Crestdale Dr Unit 1305 Houston, TX | 4.0 | 2.0 | 1600 | $1,819 | $1.14 | 45d | 1 | 1.18mi |
| 3125 Crestdale Dr Unit 1006 Houston, TX | 3.0 | 2.0 | 1500 | $1,629 | $1.09 | 45d | 1 | 1.18mi |
| 3125 Crestdale Dr Unit 1082 Houston, TX | 4.0 | 2.0 | 1600 | $1,200 | $0.75 | 45d | 1 | 1.18mi |
| 3125 Crestdale Dr Unit 1091 Houston, TX | 3.0 | 2.0 | 1450 | $1,500 | $1.03 | 45d | 1 | 1.18mi |
| 3125 Crestdale Dr Unit 2346 Houston, TX | 3.0 | 2.0 | 1354 | $1,499 | $1.11 | 45d | 1 | 1.18mi |
| 11002 Hammerly Blvd Houston, TX | 2.0–4.0 | 2.5 | 1686 | $1,700 | $1.01 | 0d | 2 | 1.20mi |
| 3125 Crestdale Dr Houston, TX | 3.0 | 3.0 | 1400 | $1,749 | $1.25 | 45d | 1 | 1.26mi |
| 1506 Witte Rd Unit 16 Houston, TX | 3.0 | 2.0 | 1350 | $1,549 | $1.15 | 45d | 1 | 1.29mi |
| 1500 Witte Rd Houston, TX | 1.0–3.0 | 1.5–2.5 | 1085 | $1,639 | $1.51 | 0d | 12 | 1.33mi |
| 3125 Crestdale Dr Unit 3158 Houston, TX | 3.0 | 2.0 | 1241 | $1,573 | $1.27 | 12d | 1 | 1.34mi |
| 3125 Crestdale Dr Unit 3148 Houston, TX | 3.0 | 2.0 | 1241 | $1,533 | $1.24 | 0d | 1 | 1.34mi |
| 10800 Clay Rd Houston, TX | 1.0–3.0 | 1.0–2.0 | 1016 | $2,010 | $1.98 | 1d | 33 | 1.39mi |
| 9634 Rockhurst Dr Houston, TX | 4.0 | 2.0 | 1881 | $2,700 | $1.44 | 45d | 1 | 1.43mi |
| 9945 Storehouse Dr Houston, TX | 3.0 | 2.5 | 2119 | $2,600 | $1.23 | 45d | 1 | 1.45mi |
HOA detail
- Monthly dues
- $340 · $4,080/yr
- Likely covers
- pool
Listing history 28 events
-
2026-06-03days on market $168,500 Pending 28 DOM
-
2026-06-02days on market $168,500 Pending 27 DOM
-
2026-06-02status $168,500 Pending 26 DOM
-
2026-06-01days on market $168,500 Active 26 DOM
-
2026-05-31days on market $168,500 Active 25 DOM
-
2026-05-06$168,500 Active 997-char remark
-
2026-04-20historical $1,850
-
2026-04-20historical
-
2026-04-12status Active
-
2026-04-10historical
-
2026-03-14$1,850
-
2026-02-10price $195,000
-
2026-01-22price $205,000
-
2026-01-16status Active
-
2025-12-03status Pending
-
2025-11-12$210,000 Active
-
2020-08-05soldstatus
-
2020-07-29soldstatus Sold
Show marketing remark (710 chars)
Fabulous Corner Lot Town-Home In The Spring Branch Area, This Home Features Lots Of Natural Lighting Throughout, Charming Kitchen And Spacious Rooms To Enjoy And Entertain Your Family & Friends. Sits Right At The Corner to Community Pool, Park/Playground And Basketball Court. Completely Renovated in 2019 With Paint Throughout, Tile Floors, And Carpet In Bedrooms. Outside Patio Includes Shed And Some Gardening Space, All Bedrooms Up, Conveniently Located Nearby HEB, Memorial City Mall, Town & Country Village, I-10, Beltway 8 And Highway 290. Great Restaurants. The Community Offers Tennis, Pool, Basketball, Play yard, Swimming Pool And Lots Of Nearby Things To Do. Schedule Your Tour Today!
-
2020-07-09status Pending
Show marketing remark (710 chars)
Fabulous Corner Lot Town-Home In The Spring Branch Area, This Home Features Lots Of Natural Lighting Throughout, Charming Kitchen And Spacious Rooms To Enjoy And Entertain Your Family & Friends. Sits Right At The Corner to Community Pool, Park/Playground And Basketball Court. Completely Renovated in 2019 With Paint Throughout, Tile Floors, And Carpet In Bedrooms. Outside Patio Includes Shed And Some Gardening Space, All Bedrooms Up, Conveniently Located Nearby HEB, Memorial City Mall, Town & Country Village, I-10, Beltway 8 And Highway 290. Great Restaurants. The Community Offers Tennis, Pool, Basketball, Play yard, Swimming Pool And Lots Of Nearby Things To Do. Schedule Your Tour Today!
-
2020-06-26status Option Pending
Show marketing remark (710 chars)
Fabulous Corner Lot Town-Home In The Spring Branch Area, This Home Features Lots Of Natural Lighting Throughout, Charming Kitchen And Spacious Rooms To Enjoy And Entertain Your Family & Friends. Sits Right At The Corner to Community Pool, Park/Playground And Basketball Court. Completely Renovated in 2019 With Paint Throughout, Tile Floors, And Carpet In Bedrooms. Outside Patio Includes Shed And Some Gardening Space, All Bedrooms Up, Conveniently Located Nearby HEB, Memorial City Mall, Town & Country Village, I-10, Beltway 8 And Highway 290. Great Restaurants. The Community Offers Tennis, Pool, Basketball, Play yard, Swimming Pool And Lots Of Nearby Things To Do. Schedule Your Tour Today!
-
2020-06-19$149,900 Active
Show marketing remark (710 chars)
Fabulous Corner Lot Town-Home In The Spring Branch Area, This Home Features Lots Of Natural Lighting Throughout, Charming Kitchen And Spacious Rooms To Enjoy And Entertain Your Family & Friends. Sits Right At The Corner to Community Pool, Park/Playground And Basketball Court. Completely Renovated in 2019 With Paint Throughout, Tile Floors, And Carpet In Bedrooms. Outside Patio Includes Shed And Some Gardening Space, All Bedrooms Up, Conveniently Located Nearby HEB, Memorial City Mall, Town & Country Village, I-10, Beltway 8 And Highway 290. Great Restaurants. The Community Offers Tennis, Pool, Basketball, Play yard, Swimming Pool And Lots Of Nearby Things To Do. Schedule Your Tour Today!
-
2019-03-26soldstatus
-
2019-02-27soldstatus Sold
-
2019-02-26status Pending
-
2019-02-25status Option Pending
-
2019-02-03$122,000 Active
-
2018-10-05soldstatus
-
1969-03-20soldstatus
ⓘ Source: listings_history table (triggers on properties + properties_extension) + one-shot
backfill from property_details.listing_events for pre-trigger history.
Tax reassessment forecast TX · Resets to sale price
- Current annual tax
- $4,915 · $410/mo
- Projected year-2 tax
- $4,915 · $410/mo
- Expected delta
- $0/yr ($0/mo · 0.0%)
ⓘ Screening estimate from a state-policy table — verify with the county assessor before closing.
Climate risk First Street
- Flood 1/10 Low FEMA zone X (unshaded) · 0% chance over 30 yrs
- Wildfire 1/10 Low
- Heat 9/10 Extreme 7 d/yr ≥109°F today · 21 d/yr by 30 yrs out
- Wind 9/10 Extreme 99% chance of damaging wind over 30 yrs
- Air quality 3/10 Moderate 2 unhealthy d/yr today · 3 by 30 yrs out
Nearby sold comps map
Loading sold comps map…
Walkable amenities ~0.75 mi
Loading nearby amenities…
Taxation est. · year 1
- Rental income
- $22,903
- − Mortgage interest
- −$9,439
- − Property taxes
- −$4,915
- − Insurance
- −$842
- − Repairs & maintenance
- −$1,832
- − Management
- −$1,832
- − HOA
- −$4,080
- − Depreciation
- −$4,902
- Taxable loss
- −$4,940
- Est. tax savings @ 24.0%
- +$1,186
- After-tax cash flow
- $-1,163/yr
For passive investors: Depreciation is non-cash, so a rental often shows a tax loss while cash-flowing — sheltering income. Rental losses are passive: they offset passive income freely, and up to $25,000/yr can offset ordinary (W-2) income if you actively participate and your MAGI is under $100k (phasing out to $0 by $150k); unused losses carry forward. On sale, claimed depreciation is recaptured at up to 25%, and gains may owe capital-gains tax (a 1031 exchange can defer both). Figures are a year-1 estimate at your 24.0% rate — not tax advice; consult a CPA.
Schools (NCES district)
- District
- Spring Branch ISD
- NCES district ID
- 4841100
- Math proficiency
- 47% ▼ -4.00%
- Reading proficiency
- 46% ▼ -1.00%
- Median HH income
- $60,311
- Composite
- 40.88/100
- National rank
- #3624
- State rank
- #215 of 826 in TX
Livability — Houston
- Score
- 74/100
- State rank
- #184
- US rank
- #4771
Category grades
Schools grade is shown separately in the Schools card above.
Census & demographics
- Census place
- Houston, TX
- County
- Harris County · 4,702,590 people
- City population
- 3,226,434
- Metro
- Houston-The Woodlands-Sugar Land, TX
- Population (ZIP)
- 29,048
- Household income
- $79,359
- Rent vs Own
- Severe rent burden
- 1667.0
Population outlook (Harris County) Hauer SSP2
- Today (2025)
- 5,571,493 people
- By 2030
- 6,089,821 · +9.3%
- By 2040
- 7,142,806 · +28.2%
- By 2050
- 8,185,864 · +46.9%
- By 2075
- 10,574,329 · +89.8%
- By 2100
- 12,109,958 · +117.4%
Race, ethnicity, and origin ACS 2023
- Neighborhood character
- Diverse neighborhood (Simpson 0.66)
- Race & ethnicity
- Hispanic / Latino 44% White 37% Two or more races 25% Black 8% Asian 6%
- Hispanic origin (detail)
- Mexican 24% Puerto Rican 3%
- Common ancestry
- Lithuanian 3% Slovak 2% Romanian 2%
- Foreign-born
- 31% · Canada, China, Vietnam
- Languages at home
- 52% English-only · Spanish 36% French/Haitian/Cajun 2% Vietnamese 1%
Political lean MEDSL · Harris
- 2024 margin
- Lean D (+5.5) · D 52.0% · R 46.4% · Other 1.6%
- 2008→2024 swing
- +3.9pp toward D · 2008: 1.6pp · 2024: 5.5pp
- All cycles
- 2024: D+5.5 2020: D+13.3 2016: D+12.4 2012: D+0.1 2008: D+1.6
Not yet ingested
- Civics
- —
Market trends
- HPI YoY
- ▼ -283.51%
- Current HPI
- 286.4053
- Rent YoY
- ▼ -0.86%
- Metro
- Houston-The Woodlands-Sugar Land, TX
- State GDP YoY
- ▲ 3.95%
- F500 in state
- 110
Industry mix (Fortune 500 HQ in TX)
| Industry | F500 HQs | Revenue |
|---|---|---|
| Energy | 16 | $1,198B |
|
||
| Technology | 5 | $198B |
|
||
| Engineering / Construction | 4 | $72B |
|
||
| Energy Services | 3 | $60B |
|
||
| Utilities | 3 | $41B |
|
||
| Healthcare | 2 | $330B |
|
||
Price history
+38.1% since first listed25 events — show timeline
- 2026-06-04 Pending — HARMLS
- 2026-06-01 Pending — HARMLS
- 2026-05-06 Listed $168,500 HARMLS
- 2026-04-20 Rental Removed $1,850 HARMLS
- 2026-04-20 Listing Removed — HARMLS
- 2026-04-12 Relisted — HARMLS
- 2026-04-10 Listing Removed — HARMLS
- 2026-03-14 Listed for Rent $1,850 HARMLS
- 2026-02-10 Price Changed $195,000 HARMLS
- 2026-01-22 Price Changed $205,000 HARMLS
- 2026-01-16 Relisted — HARMLS
- 2025-12-03 Pending — HARMLS
- 2025-11-12 Listed $210,000 HARMLS
- 2020-08-05 Sold (Public Records) — Public Records
- 2020-07-29 Sold (MLS) — HARMLS
- 2020-07-09 Pending — HARMLS
- 2020-06-26 Pending — HARMLS
- 2020-06-19 Listed $149,900 HARMLS
- 2019-03-26 Sold (Public Records) — Public Records
- 2019-02-27 Sold (MLS) — HARMLS
- 2019-02-26 Pending — HARMLS
- 2019-02-25 Pending — HARMLS
- 2019-02-03 Listed $122,000 HARMLS
- 2018-10-05 Sold (Public Records) — Public Records
- 1969-03-20 Sold (Public Records) — Public Records
Property tax history
+7.6%/yrLatest (2025): $4,915 · +0.0% YoY. Source: county tax records.
Cash-flow waterfall
monthlySold comps — $/sqft
last 12 mo · ≤1 miLoading sold comps…