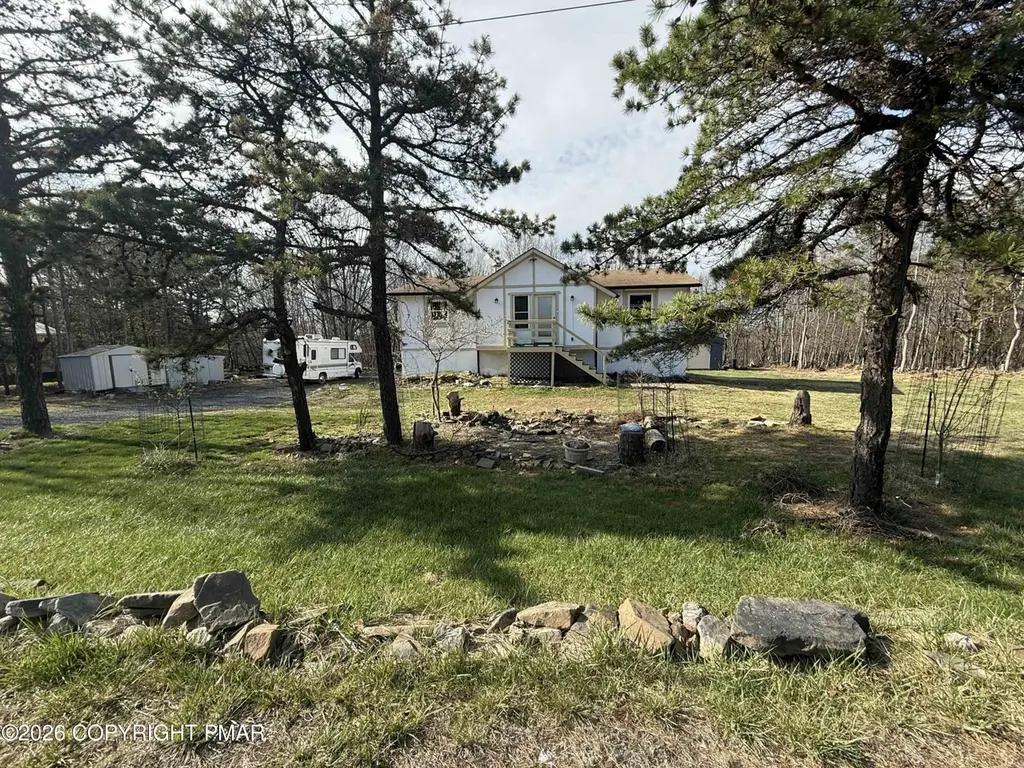
2354 Candlewood Ln · Sierra View, PA
Flood risk 1/10 · Minimal
- FEMA flood zone
- X (unshaded)
- Chance of flooding over 30 yrs
- 0.0%
- Est. flood insurance / yr
- $473 – $860
Fire risk 3/10 · Minor
- Est. fire insurance / yr
- $511 – $949
Heat risk 1/10 · Minimal
- Hot days now (above 92°F)
- 7 days/yr
- Hot days in 30 yrs
- 15 days/yr
Wind risk 4/10 · Minor
- Chance of severe wind over 30 yrs
- 9.0%
Air-quality risk 3/10 · Minor
- Unhealthy air days now
- 1 days/yr
- Unhealthy air days in 30 yrs
- 4 days/yr
Risk factors via First Street. Map © Google.
Why this score? — see what drove the C- grade
The composite is a weighted blend of 9 inputs, each scored 0–100. Each bar is that input's sub-score; the figure is the points it added to the 100-point composite (weight × sub-score).
- ARV discount +15.0/15.0
- Cash flow +12.7/30.0
- Appreciation +5.2/10.0
- Schools +4.0/10.0
- DSCR +3.8/10.0
- 1% rule +3.4/10.0
- Livability +3.1/5.0
- Rent growth +2.5/5.0
- Condition / age +2.5/5.0
$249,900
🖨 Deal sheet (PDF) 📄 Offer letter ✓ Due diligence
Listing remarks MLS
Opportunity Knocks! 3 bedrooms 1.5 baths, 1 car garage, 1 acre, raised ranch. Finish the basement for additional living space. Low dues and Low taxes. Home is missing cooper. Sold ''AS IS'' CONDITION. Buyer is responsible for 2% Transfer Tax. Cash Only.
Key facts
- 1.15 acre lot
- Garage
- Community pool
Property features AI
Finance
- HOA & community: Homeowners association with clubhouse, party room, and pool; Annual association fee of $219 (approximately $18.25/month)
Exterior
- Parking: Total of 7 parking spaces; 1-car garage that faces front; 6 open parking spaces; Driveway; Gravel surfaces
- Utilities: Well water; Septic tank; 200+ amp electric service
- Home design: Single-family house; Residential property; Facing direction: not specified
- Construction: Synthetic stucco exterior; Asphalt roof; Block and combination foundation; Built year: not specified
- Exterior features: Patio; Level lot with front and back yard; Private maintained paved road; Shed(s)
Interior
- Kitchen: Oven; Double oven; Electric range; Refrigerator; Dishwasher; Water heater
- Bedrooms: Total rooms: 10
- Flooring: Vinyl; Carpet; Ceramic tile; Laminate
- Bathrooms: 1 full bathroom; 1 half bathroom
- Heating & cooling: Baseboard heating (electric)
- Interior features: Breakfast bar; Double vanity; One fireplace with gas log located in the basement; Unfurnished
- Laundry & utility: Laundry in lower level; Electric dryer hookup
Neighborhood map
What this means for you Summary
Snapshot
- This is a 3-bed/1.5-bath single-family listed at $250k.
Deal economics
- At list price, monthly cash flow is $-27 ($-326/yr) — negative.
- To cash-flow at today's rent, offer at most $245k (1.9% below list).
- To meet the 1% rule (rent ≥ 1% of price), the offer needs to be $211k (15.5% below list).
- Recommended offer: $211k (15.5% below list) — sets the bar for 1% rule.
- Cap rate 6.2% vs local median 3.5% in Sierra View — top-decile yield for the area; either an underpriced asset or a hidden risk that comps aren't pricing in. Stress-test before assuming the spread holds.
Location & tenants
- Location reads 62/100 on livability (#1,371 in PA) — a middle-class / working-renter tenant base. Strengths: cost of living A+, housing A+, crime B+; Watch: health & safety D, schools F, amenities F.
- Pocono Mountain SD (rural): math 37% / reading 55% proficiency, ranked #245 of 539 in PA (top 46%) — families likely to look elsewhere, expect single-tenant / working-renter base with shorter leases.
- Market conditions: 90 active listings in the ZIP; 278 units permitted in Monroe County in 2024 (52 in 5+ unit buildings).
Forward outlook
- In year one you build about $3k of equity ($2k loan paydown + $1k appreciation (0.5% local appreciation)).
- Monroe County population projected at -11% by 2050 — secular population decline; favor cash flow + early exit over multi-decade hold.
- By year 10, paydown + projected appreciation supports a ~$34k cash-out refi (75% LTV) — recoverable capital for the next deal without selling this one.
Negotiation context
- It's been on market 57 days — a 3% lower offer ($242k) is reasonable based on typical stale-listing flexibility.
- 2 sale attempts since 10y ago with the ask held roughly flat each time — persistent listings suggest the price (not the market) is what's stuck; bring a comps-based counter.
- Current owner paid $37k; list at $250k implies a 575% gain — meaningful room to come down on a strong offer.
Questions for the listing agent
- What do current leases actually rent for vs. the listed asking? Can we see a recent rent roll and the last 12 months of T-12 income?
- It's been on market 57 days. Have you received any prior offers? Is the seller open to a 16% concession, seller financing, or rate buy-down credit?
- What does the HOA fee cover, when was the last increase, and are there any pending special assessments or reserve-fund shortfalls?
- Is there a deadline driving the sale (1031 exchange, divorce, estate, relocation)? That informs how much negotiation room exists.
- Schools are F-rated, which usually means shorter tenancies and higher turnover. Who's the typical renter profile here, and what's been the actual vacancy rate?
- What's the average days-on-market for RENTAL listings here right now (not sales)? A rising rental-DOM trend means longer vacancies and softer asking-rent achievability than the comps imply.
- What's the recent tenant-quality profile in this submarket — average credit score on applications, eviction rate, late-payment / NSF rate, and stable-employment percentage? A property-management company in the area should have these aggregated.
- How much new for-sale + rental construction is in the pipeline within 1–3 miles? Heavy new supply typically softens prices + rents 12–24 months out; constrained supply supports both.
Investment metrics
- 1% rule
- 0.84% ✗
- Cap rate
- 6.16%
- Cash-on-cash
- -0.47%
- DSCR
- 0.98
- GRM
- 9.9
CMA / ARV
- ARV (median comp)
- $305,478
- List price
- $249,900
- Delta
- -18.19%
- Verdict
- UNDERPRICED
- Comps
- 20 within 1.0 mi
Show comp detail 1 sale within ~0.75 mi
| Address | Dist | Beds/Ba | Sqft | Sold | Price | $/sf | Match |
|---|---|---|---|---|---|---|---|
| 2272 Bismark Rd | 0.25mi | 3/1.0 | 944 (-4%) | 6mo | $200,000 | $212 | 75 |
Match score weights: distance 35% · size 25% · config 20% · recency 20%. Top-matched comps best support the ARV.
Projected returns pro-forma
0.47% appreciation · 3.0% rent growth · sell at horizon
- IRR
- -1.0%
- Equity multiple
- 0.95×
- Total profit
- $-3,482
- Equity at exit
- $78,466
- IRR
- 4.2%
- Equity multiple
- 1.49×
- Total profit
- $33,968
- Equity at exit
- $99,169
Cash invested: $69,972 (down + closing). Projections, not guarantees.
Landlord ↔ Tenant lean methodology
- Overall (STATE)
- 62 Landlord-Friendly
- State Pennsylvania
- 62 Landlord-Friendly · EVEN
- County
- — inherits STATE
- City
- — inherits STATE
ZIP-level market 18610
- Home prices YoY
- 0.3%
- Active inventory
- 90
- Price-to-rent
- 9.9×
Monthly cashflow live
- Estimated rent
- $2,111 medium interval (Pro) →
- Mortgage (P&I)
- −$1,311
- Tax from tax record
- −$262 /mo · $3,143/yr
- Insurance
- −$104
- HOA
- −$18
- Vacancy / Maint / Mgmt
- −$443
- Net cashflow
- $-27
Break-even live
Sensitivity live
| Price | -10% $114 | -5% $44 | +0% $-27 | +5% $-98 | +10% $-169 |
|---|---|---|---|---|---|
| Rent | -10% $-194 | -5% $-111 | +0% $-27 | +5% $56 | +10% $140 |
| Rate | -1.0pp $99 | -0.5pp $36 | base $-27 | +0.5pp $-92 | +1.0pp $-158 |
UW: 25.0% down · 7.5% · 30yr · 1.5% tax · 5.0% vac · 8.0% maint · 8.0% mgmt
Financing live
Cash to close
- Down payment
- $62,475
- Closing costs
- $7,497
- Reserves months
- —
- Total cash needed
- —
Loan-product check · same deal, 3 products live
Conventional
25% down · 7.5% · 30yr
- Down + closing
- —
- Monthly P&I
- —
- Monthly cashflow
- —
- DSCR
- —
- Eligible?
- —
Personal DTI + credit; lowest rate.
DSCR
20% down · 8.5% · 30yr
- Down + closing
- —
- Monthly P&I
- —
- Monthly cashflow
- —
- DSCR
- —
- Eligible?
- —
No personal income docs; deal must DSCR.
Hard money
10% down · 12.0% · 12mo
- Down + closing
- —
- Monthly P&I
- —
- Monthly cashflow
- —
- DSCR
- —
- Eligible?
- —
Short-term bridge; refi at stabilization.
HOA detail
- Monthly dues
- $18 · $216/yr
Listing history 19 events
-
2026-06-19days on market $249,900 Active 57 DOM
-
2026-06-18days on market $249,900 Active 56 DOM
-
2026-06-17days on market $249,900 Active 55 DOM
-
2026-06-16days on market $249,900 Active 54 DOM
-
2026-06-15days on market $249,900 Active 53 DOM
-
2026-06-14days on market $249,900 Active 51 DOM
-
2026-06-13days on market $249,900 Active 50 DOM
-
2026-06-10days on market $249,900 Active 48 DOM
-
2026-06-09days on market $249,900 Active 47 DOM
-
2026-06-08days on market $249,900 Active 46 DOM
-
2026-06-07days on market $249,900 Active 45 DOM
-
2026-06-02days on market $249,900 Active 40 DOM
-
2026-06-01pricedays on market $249,900 Active 39 DOM
-
2026-05-31days on market $254,000 Active 38 DOM
-
2026-05-30days on market $254,000 Active 37 DOM
-
2026-04-19$254,000 Active 164-char remark
-
2016-11-17soldstatus $37,000 253-char remark
Show marketing remark (253 chars)
Opportunity Knocks! 3 bedrooms 1.5 baths, 1 car garage, 1 acre, raised ranch. Finish the basement for additional living space. Low dues and Low taxes. Home is missing cooper. Sold ''AS IS'' CONDITION. Buyer is responsible for 2% Transfer Tax. Cash Only.
-
2016-09-28$39,900 253-char remark
Show marketing remark (253 chars)
Opportunity Knocks! 3 bedrooms 1.5 baths, 1 car garage, 1 acre, raised ranch. Finish the basement for additional living space. Low dues and Low taxes. Home is missing cooper. Sold ''AS IS'' CONDITION. Buyer is responsible for 2% Transfer Tax. Cash Only.
-
2004-11-24soldstatus $128,900
ⓘ Source: listings_history table (triggers on properties + properties_extension) + one-shot
backfill from property_details.listing_events for pre-trigger history.
Tax reassessment forecast PA · Partial reset (capped growth)
- Current annual tax
- $3,143 · $262/mo
- Projected year-2 tax
- $3,546 · $295/mo
- Expected delta
- +$402/yr (+$34/mo · 12.8%)
ⓘ Screening estimate from a state-policy table — verify with the county assessor before closing.
Climate risk First Street
- Flood 1/10 Low FEMA zone X (unshaded) · 0% chance over 30 yrs
- Wildfire 3/10 Moderate
- Heat 1/10 Low 7 d/yr ≥92°F today · 15 d/yr by 30 yrs out
- Wind 4/10 Moderate 9% chance of damaging wind over 30 yrs
- Air quality 3/10 Moderate 1 unhealthy d/yr today · 4 by 30 yrs out
Nearby sold comps map
Loading sold comps map…
Walkable amenities ~0.75 mi
Loading nearby amenities…
Taxation est. · year 1
- Rental income
- $25,327
- − Mortgage interest
- −$13,998
- − Property taxes
- −$3,143
- − Insurance
- −$1,250
- − Repairs & maintenance
- −$2,026
- − Management
- −$2,026
- − HOA
- −$216
- − Depreciation
- −$7,270
- Taxable loss
- −$4,602
- Est. tax savings @ 24.0%
- +$1,104
- After-tax cash flow
- $778/yr
For passive investors: Depreciation is non-cash, so a rental often shows a tax loss while cash-flowing — sheltering income. Rental losses are passive: they offset passive income freely, and up to $25,000/yr can offset ordinary (W-2) income if you actively participate and your MAGI is under $100k (phasing out to $0 by $150k); unused losses carry forward. On sale, claimed depreciation is recaptured at up to 25%, and gains may owe capital-gains tax (a 1031 exchange can defer both). Figures are a year-1 estimate at your 24.0% rate — not tax advice; consult a CPA.
Schools (NCES district)
- District
- Pocono Mountain SD
- NCES district ID
- 4219500
- Math proficiency
- 37% ▼ -5.00%
- Reading proficiency
- 55% ▲ 1.00%
- Median HH income
- $55,317
- Composite
- 39.91/100
- National rank
- #3856
- State rank
- #245 of 539 in PA
Livability — Sierra View
- Score
- 62/100
- State rank
- #1371
- US rank
- #17228
Category grades
Schools grade is shown separately in the Schools card above.
Census & demographics
- Census place
- Sierra View, PA
- Population (ZIP)
- 4,373
Population outlook (Monroe County) Hauer SSP2
- Today (2025)
- 164,099 people
- By 2030
- 161,412 · -1.6%
- By 2040
- 154,616 · -5.8%
- By 2050
- 146,710 · -10.6%
- By 2075
- 140,830 · -14.2%
- By 2100
- 138,472 · -15.6%
Race, ethnicity, and origin ACS 2023
- Neighborhood character
- Highly diverse neighborhood (Simpson 0.73)
- Race & ethnicity
- White 46% Hispanic / Latino 17% Black 15% Two or more races 10% Asian 7%
- Hispanic origin (detail)
- Puerto Rican 13%
- Common ancestry
- Romanian 6% Subsaharan African 2% Iranian 1%
- Foreign-born
- 9% · Canada
- Languages at home
- 85% English-only · Spanish 9% Tagalog/Filipino 3% Russian/Polish/Slavic 2%
Political lean MEDSL · Monroe
- 2024 margin
- Toss-up / Even · D 49.1% · R 49.9%
- 2008→2024 swing
- -17.1pp toward R · 2008: 16.3pp · 2024: -0.8pp
- All cycles
- 2024: R+0.8 2020: D+6.4 2016: D+0.3 2012: D+14.0 2008: D+16.3
Not yet ingested
- Civics
- —
Market trends
- HPI YoY
- ▲ 0.47%
- Current HPI
- 181.9087
- Rent YoY
- —
- Metro
- —
- State GDP YoY
- ▲ 1.68%
- F500 in state
- 34
Industry mix (Fortune 500 HQ in PA)
| Industry | F500 HQs | Revenue |
|---|---|---|
| Healthcare | 2 | $309B |
|
||
| Insurance | 2 | $27B |
|
||
| Telecommunications / Media | 1 | $124B |
|
||
| Industrial Distribution | 1 | $22B |
|
||
| Financial Services | 1 | $20B |
|
||
| Chemicals / Materials | 1 | $18B |
|
||
Price history
+93.9% since first listed5 events — show timeline
- 2026-06-01 Price Changed $249,900 PMAR
- 2026-04-19 Listed $254,000 PMAR
- 2016-11-17 Sold (MLS) $37,000 PMAR
- 2016-09-28 Listed $39,900 PMAR
- 2004-11-24 Sold (Public Records) $128,900 Public Records
Property tax history
+2.7%/yrLatest (2026): $3,143 · +3.4% YoY. Source: county tax records.
Cash-flow waterfall
monthlySold comps — $/sqft
last 12 mo · ≤1 miLoading sold comps…