2915 Mclean Chapel Church Rd · Bunnlevel, NC
Flood risk 1/10 · Minimal
- FEMA flood zone
- X (unshaded)
- Chance of flooding over 30 yrs
- 0.0%
- Est. flood insurance / yr
- $507 – $1,088
Fire risk 6/10 · Moderate
- Est. fire insurance / yr
- $906 – $1,684
Heat risk 7/10 · Major
- Hot days now (above 106°F)
- 7 days/yr
- Hot days in 30 yrs
- 16 days/yr
Wind risk 6/10 · Moderate
- Chance of severe wind over 30 yrs
- 68.0%
Air-quality risk 2/10 · Minimal
- Unhealthy air days now
- 1 days/yr
- Unhealthy air days in 30 yrs
- 1 days/yr
Risk factors via First Street. Map © Google.
Why this score? — see what drove the D grade
The composite is a weighted blend of 9 inputs, each scored 0–100. Each bar is that input's sub-score; the figure is the points it added to the 100-point composite (weight × sub-score).
- Cash flow +11.9/30.0
- ARV discount +11.3/15.0
- Appreciation +5.4/10.0
- DSCR +3.5/10.0
- Schools +3.0/10.0
- Livability +2.7/5.0
- Rent growth +2.5/5.0
- Condition / age +2.5/5.0
- 1% rule +2.2/10.0
$249,900
🖨 Deal sheet (PDF) 📄 Offer letter ✓ Due diligence
Listing remarks
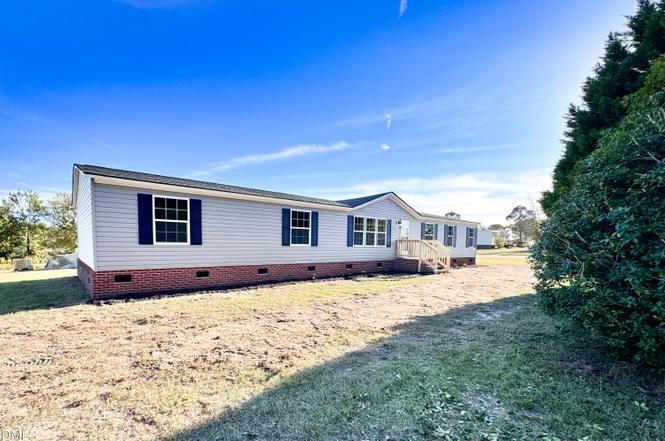
Welcome home! This 3-bedroom, 2 full bath home is move-in ready with a new roof covering, new vinyl siding, new windows, new appliances, new water heater, and new carpet/LVP! Talk about a package deal! The lot is large enough for enjoyment, recreation, a garden, and so much more. The interior is stylishly appointed and waiting to wow your guests while providing a comfortable place to call home. Make your showing appointment today!
Key facts
- New carpet
- New water heater
- New appliances
Tags
Property features AI
Finance
- Other: Zoned RA-20M
- Financial info: Annual tax shown
- HOA & community: No homeowner association
Exterior
- Utilities: Public water; Septic tank
- Home design: Manufactured double-wide home; Single-story
- Construction: Vinyl siding construction; Shingle roof; Crawl space foundation; Manufactured house
- Exterior features: Shingle roof; Vinyl siding; Lot approximately 0.88 acre; Publicly maintained road access
Interior
- Bedrooms: Three bedrooms (all on the main level)
- Flooring: Carpet; Luxury vinyl
- Bathrooms: Two full bathrooms
- Heating & cooling: Fireplace(s); Heat pump heating; Central air conditioning
- Interior features: Carpet and luxury vinyl flooring; Crawl space basement
Neighborhood map
What this means for you Summary
Snapshot
- This is a 3-bed/2.0-bath manufactured listed at $250k.
Deal economics
- At list price, monthly cash flow is $-63 ($-757/yr) — negative.
- To cash-flow at today's rent, offer at most $239k (4.5% below list).
- To meet the 1% rule (rent ≥ 1% of price), the offer needs to be $179k (28.3% below list).
- Recommended offer: $179k (28.3% below list) — sets the bar for 1% rule.
- Cap rate 6.0% vs local median 3.6% in Bunnlevel — top-decile yield for the area; either an underpriced asset or a hidden risk that comps aren't pricing in. Stress-test before assuming the spread holds.
Location & tenants
- Location reads 53/100 on livability (#676 in NC) — a working-class tenant base; expect higher turnover. Strengths: cost of living A+, crime A; Watch: amenities F, commute F, employment F.
- Harnett County Schools (rural): math 31% / reading 39% proficiency, ranked #130 of 178 in NC (top 73%) — families likely to look elsewhere, expect single-tenant / working-renter base with shorter leases.
- Zoned schools: Anderson Creek Primary (582 students, 61% FRL); Overhills Middle (math 29% / reading 40%, grade F, #292 of 475 statewide, top 62%, 799 students, 61% FRL); Overhills High (math 52% / reading 63%, grade C, #245 of 535 statewide, top 46%, 1,971 students, 47% FRL).
- Market conditions: 91 active listings in the ZIP; 2,080 units permitted in Harnett County in 2024 (12 in 5+ unit buildings).
Forward outlook
- In year one you build about $4k of equity ($2k loan paydown + $2k appreciation (0.9% local appreciation)).
- Harnett County population projected at +42% by 2050 — long-run rental-demand tailwind backs the buy-and-hold thesis.
- By year 8, paydown + projected appreciation supports a ~$32k cash-out refi (75% LTV) — recoverable capital for the next deal without selling this one.
Negotiation context
- It's been on market 113 days — a 9% lower offer ($227k) is reasonable based on typical stale-listing flexibility.
- 6 sale attempts since 21y ago; this cycle's ask has dropped $20k (7%) from the opening price — seller is motivated, your offer sets the floor, not the list.
- Current owner paid $120k; list at $250k implies a 108% gain — meaningful room to come down on a strong offer.
Risks & watch-outs
- Climate carrying-cost: major wind risk, 68% chance of damaging wind over 30y; major wildfire risk; extreme-heat days projected 7→16/yr by 2055 (HVAC capex compounding) — expect insurance premiums to compound above CPI over the hold.
Questions for the listing agent
- What do current leases actually rent for vs. the listed asking? Can we see a recent rent roll and the last 12 months of T-12 income?
- It's been on market 113 days. Have you received any prior offers? Is the seller open to a 28% concession, seller financing, or rate buy-down credit?
- Why hasn't it sold? Are there any deal-killer items the seller is aware of (foundation, flood, title, zoning, code violations)?
- Is there a deadline driving the sale (1031 exchange, divorce, estate, relocation)? That informs how much negotiation room exists.
- Schools are F-rated, which usually means shorter tenancies and higher turnover. Who's the typical renter profile here, and what's been the actual vacancy rate?
- The area grade is low — what's the realistic commute time and amenity access for the typical tenant pool here? Any planned neighborhood developments (good or bad) we should know about?
- What's the average days-on-market for RENTAL listings here right now (not sales)? A rising rental-DOM trend means longer vacancies and softer asking-rent achievability than the comps imply.
- What's the recent tenant-quality profile in this submarket — average credit score on applications, eviction rate, late-payment / NSF rate, and stable-employment percentage? A property-management company in the area should have these aggregated.
- How much new for-sale + rental construction is in the pipeline within 1–3 miles? Heavy new supply typically softens prices + rents 12–24 months out; constrained supply supports both.
Investment metrics
- 1% rule
- 0.72% ✗
- Cap rate
- 5.99%
- Cash-on-cash
- -1.08%
- DSCR
- 0.95
- GRM
- 11.6
CMA / ARV
- ARV (on-the-fly)
- $272,916
- Comps found
- 2
Show comp detail 2 sales within ~0.75 mi
| Address | Dist | Beds/Ba | Sqft | Sold | Price | $/sf | Match |
|---|---|---|---|---|---|---|---|
| 2455 Mclean Chapel Church Rd | 0.44mi | 3/2.0 | 1,772 (-14%) | 6mo | $235,000 | $133 | 52 |
| 2325 Mclean Chapel Church Rd | 0.57mi | 4/2.0 (+1) | 2,251 (+10%) | 16mo | $275,000 | $122 | 39 |
Match score weights: distance 35% · size 25% · config 20% · recency 20%. Top-matched comps best support the ARV.
Projected returns pro-forma
0.9% appreciation · 3.0% rent growth · sell at horizon
- IRR
- -0.2%
- Equity multiple
- 0.99×
- Total profit
- $-715
- Equity at exit
- $83,986
- IRR
- 4.6%
- Equity multiple
- 1.56×
- Total profit
- $39,095
- Equity at exit
- $110,592
Cash invested: $69,972 (down + closing). Projections, not guarantees.
Landlord ↔ Tenant lean methodology
- Overall (STATE)
- 85 Strongly Landlord-Friendly
- State North Carolina
- 85 Strongly Landlord-Friendly · R+3
- County
- — inherits STATE
- City
- — inherits STATE
ZIP-level market 28323
- Home prices YoY
- 0.4%
- Active inventory
- 91
- Price-to-rent
- 11.6×
Monthly cashflow live
- Estimated rent
- $1,791 medium interval (Pro) →
- Mortgage (P&I)
- −$1,311
- Tax from tax record
- −$63 /mo · $762/yr
- Insurance
- −$104
- HOA
- −$0
- Vacancy / Maint / Mgmt
- −$376
- Net cashflow
- $-63
Break-even live
Sensitivity live
| Price | -10% $78 | -5% $8 | +0% $-63 | +5% $-134 | +10% $-205 |
|---|---|---|---|---|---|
| Rent | -10% $-205 | -5% $-134 | +0% $-63 | +5% $8 | +10% $78 |
| Rate | -1.0pp $63 | -0.5pp $1 | base $-63 | +0.5pp $-128 | +1.0pp $-194 |
UW: 25.0% down · 7.5% · 30yr · 1.5% tax · 5.0% vac · 8.0% maint · 8.0% mgmt
Financing live
Cash to close
- Down payment
- $62,475
- Closing costs
- $7,497
- Reserves months
- —
- Total cash needed
- —
Loan-product check · same deal, 3 products live
Conventional
25% down · 7.5% · 30yr
- Down + closing
- —
- Monthly P&I
- —
- Monthly cashflow
- —
- DSCR
- —
- Eligible?
- —
Personal DTI + credit; lowest rate.
DSCR
20% down · 8.5% · 30yr
- Down + closing
- —
- Monthly P&I
- —
- Monthly cashflow
- —
- DSCR
- —
- Eligible?
- —
No personal income docs; deal must DSCR.
Hard money
10% down · 12.0% · 12mo
- Down + closing
- —
- Monthly P&I
- —
- Monthly cashflow
- —
- DSCR
- —
- Eligible?
- —
Short-term bridge; refi at stabilization.
Listing history 35 events
-
2026-06-21days on market $249,900 Active 113 DOM
-
2026-06-18days on market $249,900 Active 110 DOM
-
2026-06-17days on market $249,900 Active 109 DOM
-
2026-06-16days on market $249,900 Active 108 DOM
-
2026-06-15days on market $249,900 Active 107 DOM
-
2026-06-14pricedays on market $249,900 Active 105 DOM
-
2026-06-10days on market $259,900 Active 102 DOM
-
2026-06-09days on market $259,900 Active 101 DOM
-
2026-06-08days on market $259,900 Active 100 DOM
-
2026-06-07days on market $259,900 Active 99 DOM
-
2026-06-05days on market $259,900 Active 96 DOM
-
2026-06-03days on market $259,900 Active 95 DOM
-
2026-06-02days on market $259,900 Active 94 DOM
-
2026-06-01days on market $259,900 Active 93 DOM
-
2026-05-31days on market $259,900 Active 92 DOM
-
2026-05-30days on market $259,900 Active 91 DOM
-
2026-04-30price $259,900
-
2026-03-13price $264,900
-
2026-02-28$269,900 Active
-
2026-01-23historical
-
2025-12-09price $274,900
-
2025-12-09price $274,900
-
2025-10-31price $279,900
-
2025-10-31price $279,900
-
2025-10-24$289,900 Active
-
2025-10-24$289,900 Active
-
2025-07-01soldstatus $120,000
-
2025-07-01soldstatus $125,000
-
2006-02-19soldstatus $41,000
-
2006-02-19soldstatus $41,000
-
2006-02-17soldstatus $41,000
-
2006-02-16soldstatus $41,000
-
2005-12-01$43,700
-
2005-12-01$43,700
-
2005-11-15$43,700
ⓘ Source: listings_history table (triggers on properties + properties_extension) + one-shot
backfill from property_details.listing_events for pre-trigger history.
Tax reassessment forecast NC · Resets to sale price
- Current annual tax
- $762 · $63/mo
- Projected year-2 tax
- $2,049 · $171/mo
- Expected delta
- +$1,287/yr (+$107/mo · 169.0%)
ⓘ Screening estimate from a state-policy table — verify with the county assessor before closing.
Climate risk First Street
- Flood 1/10 Low FEMA zone X (unshaded) · 0% chance over 30 yrs
- Wildfire 6/10 Major
- Heat 7/10 Severe 7 d/yr ≥106°F today · 16 d/yr by 30 yrs out
- Wind 6/10 Major 68% chance of damaging wind over 30 yrs
- Air quality 2/10 Low 1 unhealthy d/yr today · 1 by 30 yrs out
Nearby sold comps map
Loading sold comps map…
Walkable amenities ~0.75 mi
Loading nearby amenities…
Taxation est. · year 1
- Rental income
- $21,495
- − Mortgage interest
- −$13,998
- − Property taxes
- −$762
- − Insurance
- −$1,250
- − Repairs & maintenance
- −$1,720
- − Management
- −$1,720
- − Depreciation
- −$7,270
- Taxable loss
- −$5,224
- Est. tax savings @ 24.0%
- +$1,254
- After-tax cash flow
- $497/yr
For passive investors: Depreciation is non-cash, so a rental often shows a tax loss while cash-flowing — sheltering income. Rental losses are passive: they offset passive income freely, and up to $25,000/yr can offset ordinary (W-2) income if you actively participate and your MAGI is under $100k (phasing out to $0 by $150k); unused losses carry forward. On sale, claimed depreciation is recaptured at up to 25%, and gains may owe capital-gains tax (a 1031 exchange can defer both). Figures are a year-1 estimate at your 24.0% rate — not tax advice; consult a CPA.
Schools (NCES district)
- District
- Harnett County Schools
- NCES district ID
- 3702010
- Math proficiency
- 31% ▼ -2.00%
- Reading proficiency
- 39% ▼ -1.00%
- Median HH income
- $45,400
- Composite
- 29.88/100
- National rank
- #6397
- State rank
- #130 of 178 in NC
Livability — Bunnlevel
- Score
- 53/100
- State rank
- #676
- US rank
- #24624
Category grades
Schools grade is shown separately in the Schools card above.
Census & demographics
- Population (ZIP)
- 4,864
Population outlook (Harnett County) Hauer SSP2
- Today (2025)
- 153,758 people
- By 2030
- 166,581 · +8.3%
- By 2040
- 192,741 · +25.4%
- By 2050
- 218,332 · +42.0%
- By 2075
- 275,422 · +79.1%
- By 2100
- 313,511 · +103.9%
Race, ethnicity, and origin ACS 2023
- Neighborhood character
- Diverse neighborhood (Simpson 0.64)
- Race & ethnicity
- White 53% Black 24% Hispanic / Latino 18% Two or more races 11% Native American 1%
- Hispanic origin (detail)
- Mexican 4% Cuban 2%
- Common ancestry
- Romanian 2% Serbian 2% Italian 1%
- Foreign-born
- 8% · Canada, South Korea
- Languages at home
- 90% English-only · Spanish 8% French/Haitian/Cajun 1% Other Indo-European 1%
Political lean MEDSL · Harnett
- 2024 margin
- Strong R (+25.1) · D 36.9% · R 62.0% · Other 1.1%
- 2008→2024 swing
- -8.4pp toward R · 2008: -16.7pp · 2024: -25.1pp
- All cycles
- 2024: R+25.1 2020: R+22.4 2016: R+24.1 2012: R+19.4 2008: R+16.7
Not yet ingested
- Civics
- —
Market trends
- HPI YoY
- ▲ 0.90%
- Current HPI
- 239.6836
- Rent YoY
- —
- Metro
- —
- State GDP YoY
- ▲ 3.28%
- F500 in state
- 26
Industry mix (Fortune 500 HQ in NC)
| Industry | F500 HQs | Revenue |
|---|---|---|
| Financial Services | 2 | $213B |
|
||
| Retail | 2 | $95B |
|
||
| Industrial Conglomerate | 1 | $38B |
|
||
| Metals / Steel | 1 | $35B |
|
||
| Utilities | 1 | $30B |
|
||
| Industrial Machinery | 1 | $19B |
|
||
Price history
+494.7% since first listed19 events — show timeline
- 2026-04-30 Price Changed $259,900 TMLS
- 2026-03-13 Price Changed $264,900 TMLS
- 2026-02-28 Listed $269,900 TMLS
- 2026-01-23 Listing Removed — TMLS
- 2025-12-09 Price Changed $274,900 LPRMLS
- 2025-12-09 Price Changed $274,900 TMLS
- 2025-10-31 Price Changed $279,900 LPRMLS
- 2025-10-31 Price Changed $279,900 TMLS
- 2025-10-24 Listed $289,900 LPRMLS
- 2025-10-24 Listed $289,900 TMLS
- 2025-07-01 Sold (Public Records) $125,000 Public Records
- 2025-07-01 Sold (Public Records) $120,000 Public Records
- 2006-02-19 Sold (MLS) $41,000 AMLSNC
- 2006-02-19 Sold (MLS) $41,000 TMLS
- 2006-02-17 Sold (Public Records) $41,000 Public Records
- 2006-02-16 Sold (MLS) $41,000 Hive MLS
- 2005-12-01 Listed $43,700 AMLSNC
- 2005-12-01 Listed $43,700 TMLS
- 2005-11-15 Listed $43,700 Hive MLS
Property tax history
-1.9%/yrLatest (2025): $762 · +0.0% YoY. Source: county tax records.
Cash-flow waterfall
monthlySold comps — $/sqft
last 12 mo · ≤1 miLoading sold comps…