15 Stevens Cove Dr · Margaret, AL
Flood risk 1/10 · Minimal
- FEMA flood zone
- X (unshaded)
- Chance of flooding over 30 yrs
- 0.0%
- Est. flood insurance / yr
- $507 – $1,088
Fire risk 5/10 · Moderate
- Est. fire insurance / yr
- $916 – $1,700
Heat risk 5/10 · Moderate
- Hot days now (above 106°F)
- 7 days/yr
- Hot days in 30 yrs
- 19 days/yr
Wind risk 6/10 · Moderate
- Chance of severe wind over 30 yrs
- 27.0%
Air-quality risk 4/10 · Minor
- Unhealthy air days now
- 3 days/yr
- Unhealthy air days in 30 yrs
- 7 days/yr
Risk factors via First Street. Map © Google.
Why this score? — see what drove the D grade
The composite is a weighted blend of 9 inputs, each scored 0–100. Each bar is that input's sub-score; the figure is the points it added to the 100-point composite (weight × sub-score).
- Cash flow +11.6/30.0
- ARV discount +9.2/15.0
- Rent growth +4.2/5.0
- 1% rule +3.5/10.0
- DSCR +3.4/10.0
- Schools +3.2/10.0
- Livability +3.2/5.0
- Condition / age +2.5/5.0
- Appreciation +0.0/10.0
$219,850
🖨 Deal sheet (PDF) 📄 Offer letter ✓ Due diligence
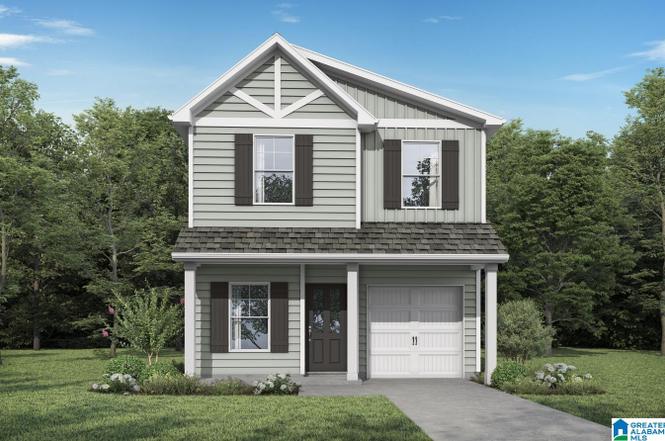
Listing remarks
The Benton. Enjoy greeting your neighbors from your large covered front porch. Invite friends & family into the comfort of your home and enjoy gathering socially in the open layout of the family room, kitchen & dining area. Upstairs your primary suite with its trey ceiling and large bathroom with dual sinks will be your peaceful retreat at the end of the day. The 2 other bedrooms also feature trey ceilings. Enjoy the convenience of the one car garage. Quartz countertops throughout the home. Photos/videos are of a similar home, options & upgrades shown may not be included in price. Complete and move-in ready! Price includes incentives.
Key facts
- Dual sinks
- One car garage
- Quartz countertops
Tags
Neighborhood map
What this means for you Summary
Snapshot
- This is a 3-bed/2.5-bath single-family listed at $220k.
Deal economics
- At list price, monthly cash flow is $-67 ($-809/yr) — negative.
- To cash-flow at today's rent, offer at most $210k (4.4% below list).
- To meet the 1% rule (rent ≥ 1% of price), the offer needs to be $186k (15.2% below list).
- Recommended offer: $186k (15.2% below list) — sets the bar for 1% rule.
- Cap rate 5.9% vs local median 4.6% in Margaret — meaningfully above typical; check what's discounted (condition, days-on-market, listing class) to confirm the premium yield is real.
Location & tenants
- Location reads 64/100 on livability (#166 in AL) — a middle-class / working-renter tenant base. Strengths: crime A+, cost of living A+, housing A+; Watch: amenities F, commute F, health & safety F.
- St Clair County (rural): math 21% / reading 52% proficiency, ranked #33 of 129 in AL (top 26%) — families likely to look elsewhere, expect single-tenant / working-renter base with shorter leases.
- Zoned schools: Moody Elementary School (math 47% / reading 67%, grade C+, #76 of 627 statewide, top 13%, 835 students, 54% FRL); Moody Middle School (math 20% / reading 61%, grade F, #56 of 257 statewide, top 22%, 524 students, 61% FRL); Moody High School (math 17% / reading 22%, grade F, #169 of 305 statewide, top 59%, 687 students, 50% FRL).
- Market conditions: Rents rising fast (+6.7%/yr); 83 active listings in the ZIP; 8 comparable units currently listed for rent nearby; rentals at typical pace (median 21d on market — plan ~3-4 weeks tenant-placement turnaround); solid renter incomes; 557 units permitted in St. Clair County in 2024 (0 in 5+ unit buildings).
Forward outlook
- Local home prices are declining (-3.0%/yr); year-one equity from $2k of loan paydown is wiped out by about $7k of value loss. Plan a longer hold.
- St. Clair County population projected at +11% by 2050 — modest demand growth; plan on rents tracking national, not racing it.
Negotiation context
- It's been on market 259 days — a 12% lower offer ($193k) is reasonable based on typical stale-listing flexibility.
- 3 sale attempts; this cycle's ask is 12719% above the opening price — seller raised mid-cycle; expect resistance to lowballs.
Risks & watch-outs
- Climate carrying-cost: major wind risk, 27% chance of damaging wind over 30y; moderate wildfire risk; extreme-heat days projected 7→19/yr by 2055 (HVAC capex compounding) — expect insurance premiums to compound above CPI over the hold.
Questions for the listing agent
- What do current leases actually rent for vs. the listed asking? Can we see a recent rent roll and the last 12 months of T-12 income?
- It's been on market 259 days. Have you received any prior offers? Is the seller open to a 15% concession, seller financing, or rate buy-down credit?
- What does the HOA fee cover, when was the last increase, and are there any pending special assessments or reserve-fund shortfalls?
- Why hasn't it sold? Are there any deal-killer items the seller is aware of (foundation, flood, title, zoning, code violations)?
- Is there a deadline driving the sale (1031 exchange, divorce, estate, relocation)? That informs how much negotiation room exists.
- The area grade is low — what's the realistic commute time and amenity access for the typical tenant pool here? Any planned neighborhood developments (good or bad) we should know about?
- What's the average days-on-market for RENTAL listings here right now (not sales)? A rising rental-DOM trend means longer vacancies and softer asking-rent achievability than the comps imply.
- What's the recent tenant-quality profile in this submarket — average credit score on applications, eviction rate, late-payment / NSF rate, and stable-employment percentage? A property-management company in the area should have these aggregated.
- How much new for-sale + rental construction is in the pipeline within 1–3 miles? Heavy new supply typically softens prices + rents 12–24 months out; constrained supply supports both.
Investment metrics
- 1% rule
- 0.85% ✗
- Cap rate
- 5.93%
- Cash-on-cash
- -1.31%
- DSCR
- 0.94
- GRM
- 9.8
CMA / ARV
- ARV (on-the-fly)
- $228,363
- Comps found
- 12
Show comp detail 12 sales within ~0.75 mi
| Address | Dist | Beds/Ba | Sqft | Sold | Price | $/sf | Match |
|---|---|---|---|---|---|---|---|
| 15 Stevens Cove Dr | 0.00mi | 3/2.5 | 1,401 (0%) | 3mo | $219,850 | $157 | 98 |
| 5618 Old Acton Rd | 0.01mi | 3/2.5 | 1,401 (0%) | 6mo | $231,673 | $165 | 95 |
| 45 Stevens Cove Dr | 0.03mi | 3/2.5 | 1,401 (0%) | 5mo | $219,850 | $157 | 94 |
| 1285 Brookhaven Ln | 0.47mi | 3/2.0 | 1,355 (-3%) | 3mo | $225,540 | $166 | 68 |
| 1260 Brookhaven Ln | 0.45mi | 3/2.0 | 1,446 (+3%) | 4mo | $225,000 | $156 | 68 |
| 1225 Brookhaven Ln | 0.49mi | 3/2.0 | 1,446 (+3%) | 3mo | $229,774 | $159 | 67 |
| 1280 Brookhaven Ln | 0.44mi | 3/2.0 | 1,337 (-5%) | 3mo | $232,952 | $174 | 67 |
| 1110 Brookhaven Ln | 0.54mi | 3/2.0 | 1,446 (+3%) | 4mo | $219,792 | $152 | 64 |
| 1150 Brookhaven Ln | 0.53mi | 3/2.0 | 1,355 (-3%) | 5mo | $219,050 | $162 | 64 |
| 1140 Brookhaven Ln | 0.53mi | 3/2.0 | 1,337 (-5%) | 4mo | $217,344 | $163 | 62 |
| 230 Andrew Ln | 0.74mi | 3/2.0 | 1,457 (+4%) | 0mo | $255,000 | $175 | 56 |
| 1025 Brookhaven Ln | 0.72mi | 3/2.0 | 1,216 (-13%) | 4mo | $210,000 | $173 | 39 |
Match score weights: distance 35% · size 25% · config 20% · recency 20%. Top-matched comps best support the ARV.
Projected returns pro-forma
-3.0% appreciation · 6.67% rent growth · sell at horizon
- IRR
- -14.4%
- Equity multiple
- 0.47×
- Total profit
- $-32,737
- Equity at exit
- $32,780
- IRR
- -0.5%
- Equity multiple
- 0.96×
- Total profit
- $-2,273
- Equity at exit
- $19,009
Cash invested: $61,558 (down + closing). Projections, not guarantees.
Landlord ↔ Tenant lean methodology
- Overall (STATE)
- 90 Strongly Landlord-Friendly
- State Alabama
- 90 Strongly Landlord-Friendly · R+15
- County
- — inherits STATE
- City
- — inherits STATE
ZIP-level market 35004
- Home prices YoY
- -26.5%
- Rents YoY
- 6.7%
- Active inventory
- 83
- Price-to-rent
- 9.8×
Monthly cashflow live
- Estimated rent
- $1,864 high interval (Pro) →
- Mortgage (P&I)
- −$1,153
- Tax est. 1.5%
- −$275 /mo · $3,298/yr
- Insurance
- −$92
- HOA
- −$21
- Vacancy / Maint / Mgmt
- −$392
- Net cashflow
- $-67
Break-even live
Sensitivity live
| Price | -10% $85 | -5% $9 | +0% $-67 | +5% $-143 | +10% $-219 |
|---|---|---|---|---|---|
| Rent | -10% $-215 | -5% $-141 | +0% $-67 | +5% $6 | +10% $80 |
| Rate | -1.0pp $43 | -0.5pp $-11 | base $-67 | +0.5pp $-124 | +1.0pp $-182 |
UW: 25.0% down · 7.5% · 30yr · 1.5% tax · 5.0% vac · 8.0% maint · 8.0% mgmt
Financing live
Cash to close
- Down payment
- $54,962
- Closing costs
- $6,596
- Reserves months
- —
- Total cash needed
- —
Loan-product check · same deal, 3 products live
Conventional
25% down · 7.5% · 30yr
- Down + closing
- —
- Monthly P&I
- —
- Monthly cashflow
- —
- DSCR
- —
- Eligible?
- —
Personal DTI + credit; lowest rate.
DSCR
20% down · 8.5% · 30yr
- Down + closing
- —
- Monthly P&I
- —
- Monthly cashflow
- —
- DSCR
- —
- Eligible?
- —
No personal income docs; deal must DSCR.
Hard money
10% down · 12.0% · 12mo
- Down + closing
- —
- Monthly P&I
- —
- Monthly cashflow
- —
- DSCR
- —
- Eligible?
- —
Short-term bridge; refi at stabilization.
Rent comps 8 comps
| Address | Beds | Baths | Sqft | Rent | $/sqft | DOM | Units | Dist |
|---|---|---|---|---|---|---|---|---|
| 15 Stevens Cove Dr Moody, AL | 3.0 | 2.5 | 1401 | $1,715 | $1.22 | 3d | 1 | 0.02mi |
| 1115 Brookhaven Dr Odenville, AL | 3.0 | 2.0 | 1209 | $1,623 | $1.34 | 3d | 1 | 0.59mi |
| 2120 W Middlebrooke Xing Unit 1 Odenville, AL | 3.0 | 2.0 | 1472 | $1,500 | $1.02 | 4d | 1 | 0.80mi |
| 860 Kent Dr Odenville, AL | 3.0 | 2.0 | 1081 | $1,475 | $1.36 | 22d | 1 | 1.25mi |
| 830 Kent Dr Odenville, AL | 3.0 | 2.0 | 1106 | $1,480 | $1.34 | 25d | 1 | 1.30mi |
| 245 Hathaway Ln Odenville, AL | 3.0 | 2.0 | 1497 | $1,661 | $1.11 | 20d | 1 | 1.30mi |
| 814 Kent Dr Odenville, AL | 3.0 | 2.0 | 1450 | $1,599 | $1.10 | 4d | 1 | 1.33mi |
| 819 Kent Dr Odenville, AL | 3.0 | 2.0 | 1106 | $1,475 | $1.33 | 25d | 1 | 1.33mi |
HOA detail
- Monthly dues
- $21 · $252/yr
Listing history 9 events
-
2026-05-22$1,715
-
2026-02-25status Pending
-
2026-01-21status Active
-
2026-01-16status Pending
-
2025-12-31price $219,850
-
2025-09-18price $226,067
-
2025-08-30price $229,850
-
2025-07-08price $233,653
-
2025-06-06$236,013 Active
ⓘ Source: listings_history table (triggers on properties + properties_extension) + one-shot
backfill from property_details.listing_events for pre-trigger history.
Climate risk First Street
- Flood 1/10 Low FEMA zone X (unshaded) · 0% chance over 30 yrs
- Wildfire 5/10 Major
- Heat 5/10 Major 7 d/yr ≥106°F today · 19 d/yr by 30 yrs out
- Wind 6/10 Major 27% chance of damaging wind over 30 yrs
- Air quality 4/10 Moderate 3 unhealthy d/yr today · 7 by 30 yrs out
Nearby sold comps map
Loading sold comps map…
Walkable amenities ~0.75 mi
Loading nearby amenities…
Taxation est. · year 1
- Rental income
- $22,374
- − Mortgage interest
- −$12,315
- − Property taxes
- −$3,298
- − Insurance
- −$1,099
- − Repairs & maintenance
- −$1,790
- − Management
- −$1,790
- − HOA
- −$252
- − Depreciation
- −$6,396
- Taxable loss
- −$4,565
- Est. tax savings @ 24.0%
- +$1,096
- After-tax cash flow
- $287/yr
For passive investors: Depreciation is non-cash, so a rental often shows a tax loss while cash-flowing — sheltering income. Rental losses are passive: they offset passive income freely, and up to $25,000/yr can offset ordinary (W-2) income if you actively participate and your MAGI is under $100k (phasing out to $0 by $150k); unused losses carry forward. On sale, claimed depreciation is recaptured at up to 25%, and gains may owe capital-gains tax (a 1031 exchange can defer both). Figures are a year-1 estimate at your 24.0% rate — not tax advice; consult a CPA.
Schools (NCES district)
- District
- St Clair County
- NCES district ID
- 0103062
- Math proficiency
- 21% ▼ -34.00%
- Reading proficiency
- 52% ▬ 0.00%
- Median HH income
- $53,324
- Composite
- 31.79/100
- National rank
- #5887
- State rank
- #33 of 129 in AL
Livability — Margaret
- Score
- 64/100
- State rank
- #166
- US rank
- #14543
Category grades
Schools grade is shown separately in the Schools card above.
Census & demographics
- Census place
- Margaret, AL
- County
- Saint Clair County · 54,404 people
- City population
- 71
- Metro
- Birmingham-Hoover, AL
- Population (ZIP)
- 12,155
- Household income
- $87,652
- Rent vs Own
- Severe rent burden
- 108.0
Population outlook (St. Clair County) Hauer SSP2
- Today (2025)
- 94,158 people
- By 2030
- 97,008 · +3.0%
- By 2040
- 101,615 · +7.9%
- By 2050
- 104,537 · +11.0%
- By 2075
- 109,350 · +16.1%
- By 2100
- 106,785 · +13.4%
Race, ethnicity, and origin ACS 2023
- Neighborhood character
- Predominantly White (78%)
- Race & ethnicity
- White 78% Black 13% Two or more races 6% Hispanic / Latino 3% Native American 1%
- Common ancestry
- Slovak 4% Lithuanian 3% Serbian 1%
- Foreign-born
- 2% · Canada
- Languages at home
- 97% English-only · Tagalog/Filipino 1% Spanish 1% French/Haitian/Cajun 1%
Political lean MEDSL · St. Clair
- 2024 margin
- Solid R (+64.1) · D 17.6% · R 81.7%
- 2008→2024 swing
- -0.9pp no change · 2008: -63.2pp · 2024: -64.1pp
- All cycles
- 2024: R+64.1 2020: R+64.0 2016: R+68.6 2012: R+66.1 2008: R+63.2
Not yet ingested
- Civics
- —
Market trends
- HPI YoY
- ▼ -64.20%
- Current HPI
- 177.6589
- Rent YoY
- ▲ 6.67%
- Metro
- Birmingham-Hoover, AL
- State GDP YoY
- ▲ 2.94%
- F500 in state
- 4
Industry mix (Fortune 500 HQ in AL)
| Industry | F500 HQs | Revenue |
|---|---|---|
| Financial Services | 1 | $8B |
|
||
| Healthcare | 1 | $5B |
|
||
Price history
-99.3% since first listed9 events — show timeline
- 2026-05-22 Listed for Rent $1,715 APPFOLIO
- 2026-02-25 Pending — Greater Alabama MLS
- 2026-01-21 Relisted — Greater Alabama MLS
- 2026-01-16 Pending — Greater Alabama MLS
- 2025-12-31 Price Changed $219,850 Greater Alabama MLS
- 2025-09-18 Price Changed $226,067 Greater Alabama MLS
- 2025-08-30 Price Changed $229,850 Greater Alabama MLS
- 2025-07-08 Price Changed $233,653 Greater Alabama MLS
- 2025-06-06 Listed $236,013 Greater Alabama MLS
Cash-flow waterfall
monthlySold comps — $/sqft
last 12 mo · ≤1 miLoading sold comps…