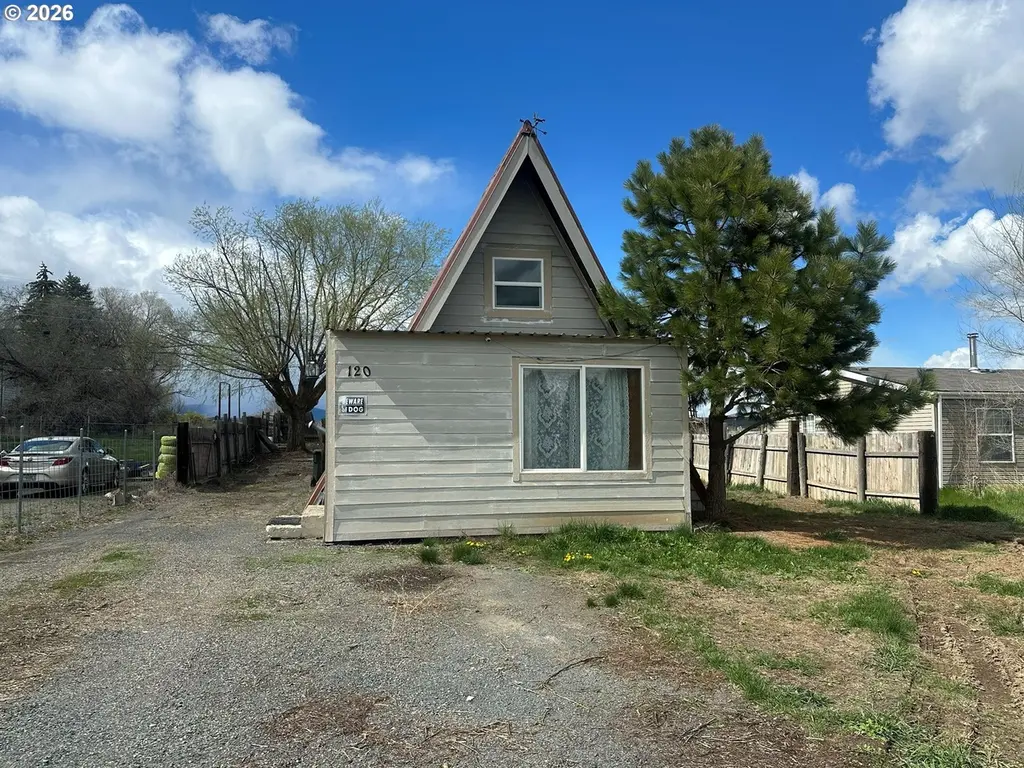
120 2nd St · North Powder, OR
Flood risk 1/10 · Minimal
- FEMA flood zone
- X
- Chance of flooding over 30 yrs
- 0.0%
- Est. flood insurance / yr
- $507 – $1,088
Fire risk 6/10 · Moderate
- Est. fire insurance / yr
- $498 – $926
Heat risk 3/10 · Minor
- Hot days now (above 92°F)
- 8 days/yr
- Hot days in 30 yrs
- 20 days/yr
Wind risk 1/10 · Minimal
- Chance of severe wind over 30 yrs
- —
Air-quality risk 6/10 · Moderate
- Unhealthy air days now
- 7 days/yr
- Unhealthy air days in 30 yrs
- 8 days/yr
Risk factors via First Street. Map © Google.
Why this score? — see what drove the D+ grade
The composite is a weighted blend of 9 inputs, each scored 0–100. Each bar is that input's sub-score; the figure is the points it added to the 100-point composite (weight × sub-score).
- Cash flow +16.6/30.0
- ARV discount +7.5/15.0
- Appreciation +5.5/10.0
- DSCR +5.1/10.0
- 1% rule +3.7/10.0
- Livability +3.1/5.0
- Rent growth +2.5/5.0
- Condition / age +2.5/5.0
- Schools +2.1/10.0
$99,999
🖨 Deal sheet (PDF) 📄 Offer letter ✓ Due diligence
Listing remarks
Discover the charm and potential of this unique A-frame retreat, ready for your finishing touches and personal vision. Located just 34 minutes from Anthony Lakes Mountain Resort, this property is an ideal basecamp for year-round adventure, whether you enjoy skiing, hiking, fishing, or peaceful mountain escapes. The home has already seen partial remodeling, giving you a head start while still leaving room to make it your own. Offering approximately 848 square feet of living space on a spacious 7,500 square foot lot, there is plenty of room to relax, expand outdoor living areas, or create the getaway you’ve always wanted. Whether you’re searching for a cozy full-time residence, a
Key facts
- Outdoor living areas
- Partial remodeling
- A-frame retreat
Tags
Property features AI
Finance
- Other: Lot approx. 0.17 acre (50' x 150'); Zoned NP-R; Not a land-lease property
Exterior
- Parking: Off-street parking; RV parking / RV access
- Utilities: Public water; Public sewer; Gas fuel
- Home design: Single-family residence; Residential property; Fixer condition; View of mountains; Main living area on main level
- Construction: Built in 1973; UAC building area
- Exterior features: Metal roof; Lap siding; Wood siding; Level lot; Paved road access
Interior
- Kitchen: Kitchen (main level)
- Bedrooms: Primary bedroom (upper level); Second bedroom
- Bathrooms: 1 full bathroom (main level)
- Heating & cooling: Gas stove heating; No central heating listed; No cooling listed
- Interior features: Family room; Great room; Dining room; Living room; Mountain view
Neighborhood map
What this means for you Summary
Snapshot
- This is a 2-bed/1.0-bath single-family listed at $100k.
Deal economics
- At list price, monthly cash flow is $60 ($719/yr) — positive.
- The deal already cash-flows at list — no discount required.
- To meet the 1% rule (rent ≥ 1% of price), the offer needs to be $87k (13.1% below list).
- Recommended offer: $87k (13.1% below list) — sets the bar for 1% rule.
Location & tenants
- Location reads 62/100 on livability (#250 in OR) — a middle-class / working-renter tenant base. Strengths: cost of living A+, housing A-; Watch: health & safety C-, schools D-, crime F.
- North Powder SD 8J (rural): math 25% / reading 25% proficiency, ranked #54 of 58 in OR (top 93%) — low school quality limits family demand, transient renter base, plan for 1-2y turnover.
- Market conditions: 10 active listings in the ZIP; 38 units permitted in Union County in 2024 (0 in 5+ unit buildings).
Forward outlook
- In year one you build about $2k of equity ($691 loan paydown + $1k appreciation (1.1% local appreciation)).
- Union County population projected to shrink 9% by 2050 — rents likely to lag national; underwrite the cash flow, not the appreciation.
- At projected returns (1.1% appreciation + 3.0% rent growth), your $28k cash investment doubles in ~8 years — after that, you're playing with house money.
Negotiation context
- It's been on market 54 days — a 3% lower offer ($97k) is reasonable based on typical stale-listing flexibility.
Risks & watch-outs
- Climate carrying-cost: major wildfire risk — expect insurance premiums to compound above CPI over the hold.
Questions for the listing agent
- It's been on market 54 days. Have you received any prior offers? Is the seller open to a 13% concession, seller financing, or rate buy-down credit?
- Built in 1973 — when were the roof, HVAC, electrical panel, plumbing, and water heater last replaced?
- Is there a deadline driving the sale (1031 exchange, divorce, estate, relocation)? That informs how much negotiation room exists.
- Schools are D-rated, which usually means shorter tenancies and higher turnover. Who's the typical renter profile here, and what's been the actual vacancy rate?
- Crime grade is F in this area — have there been break-ins, vandalism, or insurance claims at this property in the last 3 years? What carrier currently insures it and at what premium?
- The area grade is low — what's the realistic commute time and amenity access for the typical tenant pool here? Any planned neighborhood developments (good or bad) we should know about?
- What's the average days-on-market for RENTAL listings here right now (not sales)? A rising rental-DOM trend means longer vacancies and softer asking-rent achievability than the comps imply.
- What's the recent tenant-quality profile in this submarket — average credit score on applications, eviction rate, late-payment / NSF rate, and stable-employment percentage? A property-management company in the area should have these aggregated.
- How much new for-sale + rental construction is in the pipeline within 1–3 miles? Heavy new supply typically softens prices + rents 12–24 months out; constrained supply supports both.
Investment metrics
- 1% rule
- 0.87% ✗
- Cap rate
- 7.01%
- Cash-on-cash
- 2.57%
- DSCR
- 1.11
- GRM
- 9.6
CMA / ARV
- ARV (median comp)
- $216,413
- List price
- $99,999
- Delta
- -53.79%
- Verdict
- UNDERPRICED
- Comps
- 5 within 1.0 mi
Projected returns pro-forma
1.09% appreciation · 3.0% rent growth · sell at horizon
- IRR
- 4.3%
- Equity multiple
- 1.22×
- Total profit
- $6,108
- Equity at exit
- $34,616
- IRR
- 8.6%
- Equity multiple
- 2.05×
- Total profit
- $29,459
- Equity at exit
- $46,374
Cash invested: $28,000 (down + closing). Projections, not guarantees.
Landlord ↔ Tenant lean methodology
- Overall (STATE)
- 28 Tenant-Leaning
- State Oregon
- 28 Tenant-Leaning · D+6
- County
- — inherits STATE
- City
- — inherits STATE
ZIP-level market 97867
- Home prices YoY
- 0.6%
- Active inventory
- 10
- Price-to-rent
- 9.6×
Monthly cashflow live
- Estimated rent
- $869 medium interval (Pro) →
- Mortgage (P&I)
- −$524
- Tax from tax record
- −$61 /mo · $730/yr
- Insurance
- −$42
- HOA
- −$0
- Vacancy / Maint / Mgmt
- −$183
- Net cashflow
- $60
Break-even live
Sensitivity live
| Price | -10% $117 | -5% $88 | +0% $60 | +5% $32 | +10% $3 |
|---|---|---|---|---|---|
| Rent | -10% $-9 | -5% $26 | +0% $60 | +5% $94 | +10% $129 |
| Rate | -1.0pp $110 | -0.5pp $85 | base $60 | +0.5pp $34 | +1.0pp $8 |
UW: 25.0% down · 7.5% · 30yr · 1.5% tax · 5.0% vac · 8.0% maint · 8.0% mgmt
Financing live
Cash to close
- Down payment
- $25,000
- Closing costs
- $3,000
- Reserves months
- —
- Total cash needed
- —
Loan-product check · same deal, 3 products live
Conventional
25% down · 7.5% · 30yr
- Down + closing
- —
- Monthly P&I
- —
- Monthly cashflow
- —
- DSCR
- —
- Eligible?
- —
Personal DTI + credit; lowest rate.
DSCR
20% down · 8.5% · 30yr
- Down + closing
- —
- Monthly P&I
- —
- Monthly cashflow
- —
- DSCR
- —
- Eligible?
- —
No personal income docs; deal must DSCR.
Hard money
10% down · 12.0% · 12mo
- Down + closing
- —
- Monthly P&I
- —
- Monthly cashflow
- —
- DSCR
- —
- Eligible?
- —
Short-term bridge; refi at stabilization.
Listing history 18 events
-
2026-06-21days on market $99,999 Active 54 DOM
-
2026-06-19days on market $99,999 Active 52 DOM
-
2026-06-18days on market $99,999 Active 51 DOM
-
2026-06-17days on market $99,999 Active 50 DOM
-
2026-06-16days on market $99,999 Active 49 DOM
-
2026-06-15days on market $99,999 Active 48 DOM
-
2026-06-14days on market $99,999 Active 46 DOM
-
2026-06-12days on market $99,999 Active 45 DOM
-
2026-06-09days on market $99,999 Active 42 DOM
-
2026-06-08days on market $99,999 Active 41 DOM
-
2026-06-07days on market $99,999 Active 40 DOM
-
2026-06-04days on market $99,999 Active 36 DOM
-
2026-06-02days on market $99,999 Active 35 DOM
-
2026-06-01days on market $99,999 Active 34 DOM
-
2026-05-31days on market $99,999 Active 33 DOM
-
2026-05-31days on market $99,999 Active 32 DOM
-
2026-05-16price $99,999 883-char remark
-
2026-04-27$110,000 Active 883-char remark
ⓘ Source: listings_history table (triggers on properties + properties_extension) + one-shot
backfill from property_details.listing_events for pre-trigger history.
Tax reassessment forecast OR · Resets to sale price
- Current annual tax
- $730 · $61/mo
- Projected year-2 tax
- $970 · $81/mo
- Expected delta
- +$240/yr (+$20/mo · 32.8%)
ⓘ Screening estimate from a state-policy table — verify with the county assessor before closing.
Climate risk First Street
- Flood 1/10 Low FEMA zone X · 0% chance over 30 yrs
- Wildfire 6/10 Major
- Heat 3/10 Moderate 8 d/yr ≥92°F today · 20 d/yr by 30 yrs out
- Wind 1/10 Low
- Air quality 6/10 Major 7 unhealthy d/yr today · 8 by 30 yrs out
Nearby sold comps map
Loading sold comps map…
Walkable amenities ~0.75 mi
Loading nearby amenities…
Taxation est. · year 1
- Rental income
- $10,433
- − Mortgage interest
- −$5,601
- − Property taxes
- −$730
- − Insurance
- −$500
- − Repairs & maintenance
- −$835
- − Management
- −$835
- − Depreciation
- −$2,909
- Taxable loss
- −$977
- Est. tax savings @ 24.0%
- +$235
- After-tax cash flow
- $953/yr
For passive investors: Depreciation is non-cash, so a rental often shows a tax loss while cash-flowing — sheltering income. Rental losses are passive: they offset passive income freely, and up to $25,000/yr can offset ordinary (W-2) income if you actively participate and your MAGI is under $100k (phasing out to $0 by $150k); unused losses carry forward. On sale, claimed depreciation is recaptured at up to 25%, and gains may owe capital-gains tax (a 1031 exchange can defer both). Figures are a year-1 estimate at your 24.0% rate — not tax advice; consult a CPA.
Schools (NCES district)
- District
- North Powder SD 8J
- NCES district ID
- 4108940
- Math proficiency
- 25% ▬ 0.00%
- Reading proficiency
- 25% ▼ -20.00%
- Median HH income
- $42,947
- Composite
- 21.39/100
- National rank
- #8355
- State rank
- #54 of 58 in OR
Livability — North Powder
- Score
- 62/100
- State rank
- #250
- US rank
- #17162
Category grades
Schools grade is shown separately in the Schools card above.
Census & demographics
- Census place
- North Powder, OR
- Population (ZIP)
- 1,057
Population outlook (Union County) Hauer SSP2
- Today (2025)
- 25,207 people
- By 2030
- 24,794 · -1.6%
- By 2040
- 23,658 · -6.1%
- By 2050
- 22,897 · -9.2%
- By 2075
- 20,885 · -17.1%
- By 2100
- 17,841 · -29.2%
Race, ethnicity, and origin ACS 2023
- Neighborhood character
- Predominantly White (93%)
- Race & ethnicity
- White 93% Two or more races 3% Hispanic / Latino 2%
- Common ancestry
- Slovak 6% Italian 3% Scottish 2%
- Foreign-born
- 2% · Canada, South Korea
- Languages at home
- 92% English-only · Other Indo-European 7%
Political lean MEDSL · Union
- 2024 margin
- Solid R (+40.6) · D 28.1% · R 68.7% · Other 3.1%
- 2008→2024 swing
- -17.0pp toward R · 2008: -23.6pp · 2024: -40.6pp
- All cycles
- 2024: R+40.6 2020: R+40.4 2016: R+41.4 2012: R+30.8 2008: R+23.6
Not yet ingested
- Civics
- —
Market trends
- HPI YoY
- ▲ 1.09%
- Current HPI
- 198.292
- Rent YoY
- —
- Metro
- —
- State GDP YoY
- ▲ 2.05%
- F500 in state
- 2
Industry mix (Fortune 500 HQ in OR)
| Industry | F500 HQs | Revenue |
|---|---|---|
| Consumer Goods | 1 | $51B |
|
||
Price history
-9.1% since first listed2 events — show timeline
- 2026-05-16 Price Changed $99,999 RMLS
- 2026-04-27 Listed $110,000 RMLS
Property tax history
+5.4%/yrLatest (2025): $730 · +1.9% YoY. Source: county tax records.
Cash-flow waterfall
monthlySold comps — $/sqft
last 12 mo · ≤1 miLoading sold comps…