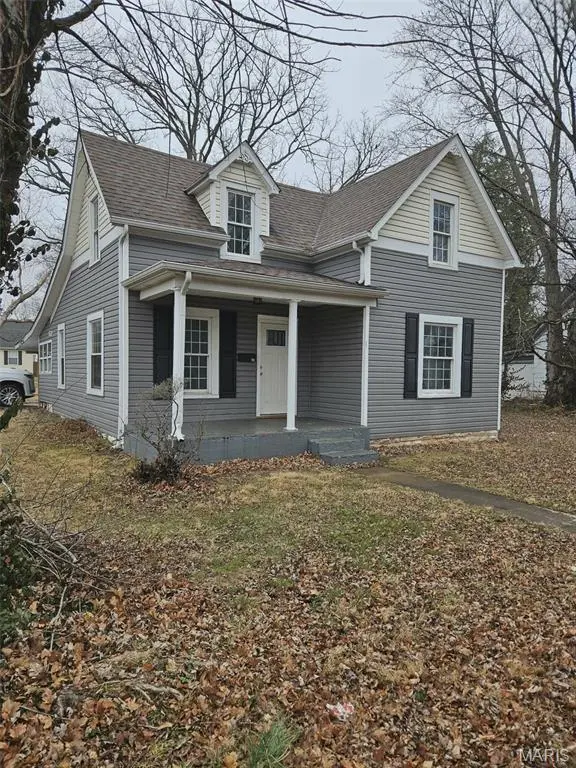
401 N Franklin St · Farmington, MO
Flood risk 1/10 · Minimal
- FEMA flood zone
- X (unshaded)
- Chance of flooding over 30 yrs
- 0.0%
- Est. flood insurance / yr
- $507 – $1,088
Fire risk 2/10 · Minimal
- Est. fire insurance / yr
- $1,054 – $1,958
Heat risk 5/10 · Moderate
- Hot days now (above 104°F)
- 7 days/yr
- Hot days in 30 yrs
- 22 days/yr
Wind risk 2/10 · Minimal
- Chance of severe wind over 30 yrs
- 1.0%
Air-quality risk 1/10 · Minimal
- Unhealthy air days now
- 0 days/yr
- Unhealthy air days in 30 yrs
- 0 days/yr
Risk factors via First Street. Map © Google.
Why this score? — see what drove the C grade
The composite is a weighted blend of 9 inputs, each scored 0–100. Each bar is that input's sub-score; the figure is the points it added to the 100-point composite (weight × sub-score).
- Cash flow +25.2/30.0
- DSCR +8.3/10.0
- ARV discount +7.5/15.0
- 1% rule +5.4/10.0
- Schools +3.8/10.0
- Livability +3.4/5.0
- Rent growth +2.5/5.0
- Condition / age +2.5/5.0
- Appreciation +0.0/10.0
$169,000
🖨 Deal sheet 📄 Offer letter ✓ Due diligence
Listing remarks
Great investment property! This updated 4 bedroom, 2 bath home features low-maintenance vinyl siding, an attached carport, and a welcoming covered front porch. The updated interior offers plenty of space and functionality, making it a great option for investors. Don’t miss this excellent opportunity! New furnace and hot water tank.
Key facts
- Covered front porch
- Hot water tank
- New furnace
Tags
Property features AI
Finance
- Financial info: Lease not considered
Exterior
- Parking: Carport (1 space)
- Utilities: Public water; Public sewer; Electricity connected (220 volts available)
- Home design: Single-family residence; Residential property; Above-grade living area recorded at 1,386 (assessor)
- Construction: Vinyl siding; Stone foundation
- Exterior features: Covered porch/patio; Corner lot; Asphalt road frontage
Interior
- Bedrooms: 4 bedrooms total (2 on the main level, 2 on the upper level)
- Bathrooms: 2 full bathrooms (1 on the main level, 1 on the upper level)
- Heating & cooling: Forced air heating; Central air conditioning
- Interior features: One-and-a-half story layout; No basement
Neighborhood map
What this means for you Summary
Snapshot
- This is a 4-bed/2.0-bath other listed at $169k.
Deal economics
- At list price, monthly cash flow is $380 ($5k/yr) — positive.
- The deal already cash-flows at list — no discount required.
- Meets the 1% rule at list price ($2k rent vs $169k).
- Recommended offer: $166k (1.5% below list) — sets the bar for market timing.
- Cap rate 9.0% vs local median 2.8% in Farmington — top-decile yield for the area; either an underpriced asset or a hidden risk that comps aren't pricing in. Stress-test before assuming the spread holds.
Location & tenants
- Location reads 67/100 on livability (#217 in MO) — a middle-class / working-renter tenant base. Strengths: cost of living A+, housing A+; Watch: employment D+, crime D, amenities F.
- Farmington R-VII (town): math 41% / reading 50% proficiency, ranked #93 of 324 in MO (top 29%) — families likely to look elsewhere, expect single-tenant / working-renter base with shorter leases.
- Zoned schools: Farmington Sr. High (math 56% / reading 63%, grade C+, #35 of 521 statewide, top 8%, 1,274 students, 42% FRL) — zoned schools at 42% FRL track the district average.
- Zoned-school proficiency averages 60% at this address vs 46% district-wide (+14 pts) — the actual schools serving this property are materially stronger than the Farmington R-VII average implies; a family-tenant draw the district grade alone would hide.
- Market conditions: 121 active listings in the ZIP; 1 comparable units currently listed for rent nearby; 134 units permitted in St. Francois County in 2024 (32 in 5+ unit buildings).
Forward outlook
- Local home prices are declining (-3.0%/yr); year-one equity from $1k of loan paydown is wiped out by about $5k of value loss. Plan a longer hold.
Negotiation context
- It's been on market 20 days — a 2% lower offer ($166k) is reasonable based on typical stale-listing flexibility.
Risks & watch-outs
- Watch-outs: built in 1900 — expect roof / HVAC / electrical / plumbing capex.
- Climate carrying-cost: extreme-heat days projected 7→22/yr by 2055 (HVAC capex compounding) — expect insurance premiums to compound above CPI over the hold.
Questions for the listing agent
- Built in 1900 — when were the roof, HVAC, electrical panel, plumbing, and water heater last replaced?
- Is there a deadline driving the sale (1031 exchange, divorce, estate, relocation)? That informs how much negotiation room exists.
- Crime grade is D in this area — have there been break-ins, vandalism, or insurance claims at this property in the last 3 years? What carrier currently insures it and at what premium?
- What's the average days-on-market for RENTAL listings here right now (not sales)? A rising rental-DOM trend means longer vacancies and softer asking-rent achievability than the comps imply.
- What's the recent tenant-quality profile in this submarket — average credit score on applications, eviction rate, late-payment / NSF rate, and stable-employment percentage? A property-management company in the area should have these aggregated.
- How much new for-sale + rental construction is in the pipeline within 1–3 miles? Heavy new supply typically softens prices + rents 12–24 months out; constrained supply supports both.
Investment metrics
- 1% rule
- 1.04% ✓
- Cap rate
- 8.99%
- Cash-on-cash
- 9.64%
- DSCR
- 1.43
- GRM
- 8.0
CMA / ARV
No comps found within radius.
Projected returns pro-forma
-3.0% appreciation · 3.0% rent growth · sell at horizon
- IRR
- -1.8%
- Equity multiple
- 0.93×
- Total profit
- $-3,256
- Equity at exit
- $25,198
- IRR
- 7.8%
- Equity multiple
- 1.59×
- Total profit
- $28,025
- Equity at exit
- $14,612
Cash invested: $47,320 (down + closing). Projections, not guarantees.
Landlord ↔ Tenant lean methodology
- Overall (STATE)
- 81 Strongly Landlord-Friendly
- State Missouri
- 81 Strongly Landlord-Friendly · R+10
- County
- — inherits STATE
- City
- — inherits STATE
ZIP-level market 63640
- Home prices YoY
- -10.6%
- Active inventory
- 121
- Price-to-rent
- 8.0×
Monthly cashflow live
- Estimated rent
- $1,750 medium interval (Pro) →
- Mortgage (P&I)
- −$886
- Tax from tax record
- −$46 /mo · $550/yr
- Insurance
- −$70
- HOA
- −$0
- Vacancy / Maint / Mgmt
- −$368
- Net cashflow
- $380
Break-even live
UW: 25.0% down · 7.5% · 30yr · 1.5% tax · 5.0% vac · 8.0% maint · 8.0% mgmt
Financing live
Cash to close
- Down payment
- $42,250
- Closing costs
- $5,070
- Reserves months
- —
- Total cash needed
- —
Loan-product check · same deal, 3 products live
Conventional
25% down · 7.5% · 30yr
- Down + closing
- —
- Monthly P&I
- —
- Monthly cashflow
- —
- DSCR
- —
- Eligible?
- —
Personal DTI + credit; lowest rate.
DSCR
20% down · 8.5% · 30yr
- Down + closing
- —
- Monthly P&I
- —
- Monthly cashflow
- —
- DSCR
- —
- Eligible?
- —
No personal income docs; deal must DSCR.
Hard money
10% down · 12.0% · 12mo
- Down + closing
- —
- Monthly P&I
- —
- Monthly cashflow
- —
- DSCR
- —
- Eligible?
- —
Short-term bridge; refi at stabilization.
Rent comps 1 comps
| Address | Beds | Baths | Sqft | Rent | $/sqft | DOM | Units | Dist |
|---|---|---|---|---|---|---|---|---|
| 100 Roper Loop Farmington, MO | 2.0–3.0 | 2.0–2.5 | 1391 | $1,750 | $1.26 | 44d | 8 | 1.43mi |
Listing history 15 events
-
2026-06-18days on market $169,000 Active 20 DOM
-
2026-06-17days on market $169,000 Active 19 DOM
-
2026-06-16days on market $169,000 Active 18 DOM
-
2026-06-15days on market $169,000 Active 17 DOM
-
2026-06-13days on market $169,000 Active 15 DOM
-
2026-06-12days on market $169,000 Active 14 DOM
-
2026-06-09days on market $169,000 Active 11 DOM
-
2026-06-08days on market $169,000 Active 10 DOM
-
2026-06-07days on market $169,000 Active 9 DOM
-
2026-06-07days on market $169,000 Active 8 DOM
-
2026-06-04days on market $169,000 Active 5 DOM
-
2026-06-02days on market $169,000 Active 4 DOM
-
2026-06-01days on market $169,000 Active 3 DOM
-
2026-05-31days on market $169,000 Active 2 DOM
-
2026-05-29$169,000 Active
ⓘ Source: listings_history table (triggers on properties + properties_extension) + one-shot
backfill from property_details.listing_events for pre-trigger history.
Tax reassessment forecast MO · Resets to sale price
- Current annual tax
- $550 · $46/mo
- Projected year-2 tax
- $1,639 · $137/mo
- Expected delta
- +$1,090/yr (+$91/mo · 198.3%)
ⓘ Screening estimate from a state-policy table — verify with the county assessor before closing.
Climate risk First Street
- Flood 1/10 Low FEMA zone X (unshaded) · 0% chance over 30 yrs
- Wildfire 2/10 Low
- Heat 5/10 Major 7 d/yr ≥104°F today · 22 d/yr by 30 yrs out
- Wind 2/10 Low 100% chance of damaging wind over 30 yrs
- Air quality 1/10 Low 0 unhealthy d/yr today · 0 by 30 yrs out
Nearby sold comps map
Loading sold comps map…
Walkable amenities ~0.75 mi
Loading nearby amenities…
Taxation est. · year 1
- Rental income
- $21,000
- − Mortgage interest
- −$9,467
- − Property taxes
- −$550
- − Insurance
- −$845
- − Repairs & maintenance
- −$1,680
- − Management
- −$1,680
- − Depreciation
- −$4,916
- Taxable income
- $1,862
- Est. tax owed @ 24.0%
- −$447
- After-tax cash flow
- $4,113/yr
For passive investors: Depreciation is non-cash, so a rental often shows a tax loss while cash-flowing — sheltering income. Rental losses are passive: they offset passive income freely, and up to $25,000/yr can offset ordinary (W-2) income if you actively participate and your MAGI is under $100k (phasing out to $0 by $150k); unused losses carry forward. On sale, claimed depreciation is recaptured at up to 25%, and gains may owe capital-gains tax (a 1031 exchange can defer both). Figures are a year-1 estimate at your 24.0% rate — not tax advice; consult a CPA.
Schools (NCES district)
- District
- Farmington R-VII
- NCES district ID
- 2911910
- Math proficiency
- 41% ▼ -5.00%
- Reading proficiency
- 50% ▼ -5.00%
- Median HH income
- $43,768
- Composite
- 38.43/100
- National rank
- #4200
- State rank
- #93 of 324 in MO
Livability — Farmington
- Score
- 67/100
- State rank
- #217
- US rank
- #10763
Category grades
Schools grade is shown separately in the Schools card above.
Census & demographics
- Census place
- Farmington, MO
- Population (ZIP)
- 28,800
Population outlook (St. Francois County) Hauer SSP2
- Today (2025)
- 68,683 people
- By 2030
- 69,574 · +1.3%
- By 2040
- 70,665 · +2.9%
- By 2050
- 70,708 · +2.9%
- By 2075
- 67,917 · -1.1%
- By 2100
- 56,563 · -17.6%
Race, ethnicity, and origin ACS 2023
- Neighborhood character
- Predominantly White (92%)
- Race & ethnicity
- White 92% Black 4% Two or more races 3% Hispanic / Latino 1%
- Common ancestry
- Lithuanian 6% Italian 2% Iranian 2%
- Foreign-born
- 2%
Political lean MEDSL · St. Francois
- 2024 margin
- Solid R (+51.4) · D 23.8% · R 75.2%
- 2008→2024 swing
- -46.8pp toward R · 2008: -4.6pp · 2024: -51.4pp
- All cycles
- 2024: R+51.4 2020: R+48.1 2016: R+45.4 2012: R+19.5 2008: R+4.6
Not yet ingested
- Civics
- —
Market trends
- HPI YoY
- ▼ -29.95%
- Current HPI
- 253.0894
- Rent YoY
- —
- Metro
- —
- State GDP YoY
- ▲ 1.84%
- F500 in state
- 20
Industry mix (Fortune 500 HQ in MO)
| Industry | F500 HQs | Revenue |
|---|---|---|
| Healthcare | 1 | $163B |
|
||
| Insurance | 1 | $21B |
|
||
| Industrial Technology | 1 | $17B |
|
||
| Retail | 1 | $16B |
|
||
| Industrial Distribution | 1 | $10B |
|
||
| Utilities | 1 | $9B |
|
||
Price history
1 event — show timeline
- 2026-05-29 Listed $169,000 MARIS as Distributed by MLS Grid
Property tax history
+0.8%/yrLatest (2025): $550 · +6.2% YoY. Source: county tax records.
Cash-flow waterfall
monthlySold comps — $/sqft
last 12 mo · ≤1 miLoading sold comps…