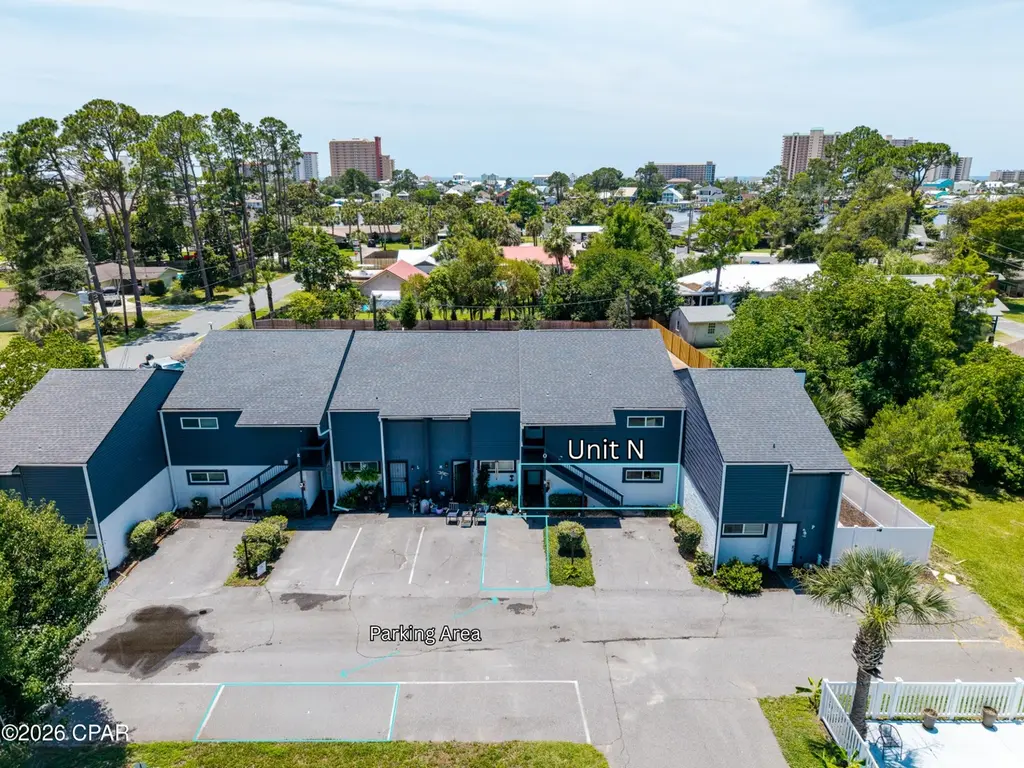
7125 N Lagoon Dr Unit N · Upper Grand Lagoon, FL
Flood risk 6/10 · Moderate
- FEMA flood zone
- X (unshaded)
- Chance of flooding over 30 yrs
- 0.72%
- Est. flood insurance / yr
- $507 – $1,088
Fire risk 1/10 · Minimal
- Est. fire insurance / yr
- $947 – $1,759
Heat risk 10/10 · Severe
- Hot days now (above 106°F)
- 7 days/yr
- Hot days in 30 yrs
- 21 days/yr
Wind risk 9/10 · Severe
- Chance of severe wind over 30 yrs
- 99.0%
Air-quality risk 1/10 · Minimal
- Unhealthy air days now
- 0 days/yr
- Unhealthy air days in 30 yrs
- 0 days/yr
Risk factors via First Street. Map © Google.
Why this score? — see what drove the D grade
The composite is a weighted blend of 9 inputs, each scored 0–100. Each bar is that input's sub-score; the figure is the points it added to the 100-point composite (weight × sub-score).
- Cash flow +12.7/30.0
- ARV discount +7.5/15.0
- Schools +4.3/10.0
- DSCR +3.8/10.0
- Condition / age +3.8/5.0
- 1% rule +3.6/10.0
- Livability +3.4/5.0
- Rent growth +3.1/5.0
- Appreciation +0.0/10.0
$220,000
🖨 Deal sheet 📄 Offer letter ✓ Due diligence
Listing remarks
This inviting GROUND FLOOR unit features a thoughtful split-bedroom layout with two spacious master suites, offering privacy and flexibility for owners, guests, or renters. The expansive open-concept living area flows beautifully, with large sliding doors that open to a private, courtyard-style side yard - an ideal sunny retreat for morning coffee, relaxing, or letting your pets enjoy some outdoor time. Whether you're looking for a full-time residence or a lucrative short-term rental opportunity, this unit delivers. The well-maintained complex offers a community pool, ample parking, and the relaxed atmosphere of a smaller, intimate community. Location is everything here. Just one block from
Key facts
- Split-bedroom layout
- Master suites
- Ground floor unit
Tags
Property features AI
Finance
- HOA & community: Has homeowners association; Association barbecue amenity; Community pool; Short-term rentals allowed
Exterior
- Parking: Dumpster available
- Utilities: Cable connected; Public sewer
- Home design: Entry on level 1
- Construction: Shingle roof; Slab foundation
- Exterior features: Covered porch; Fenced yard; In-ground community pool; Paved lot
Interior
- Kitchen: Electric cooktop; Electric range
- Bedrooms: Primary bedroom (second level); Bedroom (second level)
- Bathrooms: 2 full bathrooms; 1 half bathroom
- Heating & cooling: Central heating; Central air; Ceiling fans
- Interior features: Covered porch
- Laundry & utility: Electric water heater
Neighborhood map
What this means for you Summary
Snapshot
- This is a 2-bed/2.5-bath condo listed at $220k. Condition is rated good.
Deal economics
- At list price, monthly cash flow is $-26 ($-311/yr) — negative.
- To cash-flow at today's rent, offer at most $216k (1.7% below list).
- To meet the 1% rule (rent ≥ 1% of price), the offer needs to be $189k (14.0% below list).
- Recommended offer: $189k (14.0% below list) — sets the bar for 1% rule.
- Cap rate 6.2% vs local median 3.2% in Upper Grand Lagoon — top-decile yield for the area; either an underpriced asset or a hidden risk that comps aren't pricing in. Stress-test before assuming the spread holds.
Location & tenants
- Location reads 67/100 on livability (#583 in FL) — a middle-class / working-renter tenant base. Strengths: housing A+, crime A, cost of living B+; Watch: schools D, amenities F, commute F.
- Bay (suburban): math 51% / reading 51% proficiency, ranked #29 of 73 in FL (top 40%) — acceptable for families but not a draw, mixed tenant base, ~2y average lease.
- Market conditions: Rents rising (+2.5%/yr); 1022 active listings in the ZIP; 19 comparable units currently listed for rent nearby; rentals at typical pace (median 21d on market — plan ~3-4 weeks tenant-placement turnaround); solid renter incomes; 2,473 units permitted in Bay County in 2024 (559 in 5+ unit buildings).
Forward outlook
- Local home prices are declining (-3.0%/yr); year-one equity from $2k of loan paydown is wiped out by about $7k of value loss. Plan a longer hold.
- Bay County population projected at +24% by 2050 — long-run rental-demand tailwind backs the buy-and-hold thesis.
Negotiation context
- It's been on market 25 days — a 2% lower offer ($217k) is reasonable based on typical stale-listing flexibility.
- 13 sale attempts since 15y ago; this cycle's ask is 10% above the opening price — seller raised mid-cycle; expect resistance to lowballs.
Risks & watch-outs
- Climate carrying-cost: major flood risk; severe wind risk, 99% chance of damaging wind over 30y; extreme-heat days projected 7→21/yr by 2055 (HVAC capex compounding) — expect insurance premiums to compound above CPI over the hold.
Questions for the listing agent
- What do current leases actually rent for vs. the listed asking? Can we see a recent rent roll and the last 12 months of T-12 income?
- Any open or pending special assessments — roof, HVAC, plumbing, elevator, façade? What's the per-unit balance and payoff schedule, and is the seller paying it off at close or rolling it to the buyer?
- Is there a deadline driving the sale (1031 exchange, divorce, estate, relocation)? That informs how much negotiation room exists.
- Schools are D-rated, which usually means shorter tenancies and higher turnover. Who's the typical renter profile here, and what's been the actual vacancy rate?
- The area grade is low — what's the realistic commute time and amenity access for the typical tenant pool here? Any planned neighborhood developments (good or bad) we should know about?
- What's the average days-on-market for RENTAL listings here right now (not sales)? A rising rental-DOM trend means longer vacancies and softer asking-rent achievability than the comps imply.
- What's the recent tenant-quality profile in this submarket — average credit score on applications, eviction rate, late-payment / NSF rate, and stable-employment percentage? A property-management company in the area should have these aggregated.
- How much new apartment / multifamily construction is in the pipeline within 1–3 miles? Heavy new supply (>2% of stock underway) typically softens rents 12–24 months out; light construction supports rent growth.
Investment metrics
- 1% rule
- 0.86% ✗
- Cap rate
- 6.15%
- Cash-on-cash
- -0.50%
- DSCR
- 0.98
- GRM
- 9.7
CMA / ARV
No comps found within radius.
Projected returns pro-forma
-3.0% appreciation · 2.55% rent growth · sell at horizon
- IRR
- -17.6%
- Equity multiple
- 0.38×
- Total profit
- $-38,122
- Equity at exit
- $32,803
- IRR
- -10.6%
- Equity multiple
- 0.37×
- Total profit
- $-38,671
- Equity at exit
- $19,022
Cash invested: $61,600 (down + closing). Projections, not guarantees.
Landlord ↔ Tenant lean methodology
- Overall (STATE)
- 87 Strongly Landlord-Friendly
- State Florida
- 87 Strongly Landlord-Friendly · R+3
- County
- — inherits STATE
- City
- — inherits STATE
ZIP-level market 32408
- Rents YoY
- 2.5%
- Active inventory
- 1022
- Price-to-rent
- 9.7×
Monthly cashflow live
- Estimated rent
- $1,892 high interval (Pro) →
- Mortgage (P&I)
- −$1,154
- Tax est. 1.5%
- −$275 /mo · $3,300/yr
- Insurance
- −$92
- HOA
- −$0
- Vacancy / Maint / Mgmt
- −$397
- Net cashflow
- $-26
Break-even live
UW: 25.0% down · 7.5% · 30yr · 1.5% tax · 5.0% vac · 8.0% maint · 8.0% mgmt
Financing live
Cash to close
- Down payment
- $55,000
- Closing costs
- $6,600
- Reserves months
- —
- Total cash needed
- —
Loan-product check · same deal, 3 products live
Conventional
25% down · 7.5% · 30yr
- Down + closing
- —
- Monthly P&I
- —
- Monthly cashflow
- —
- DSCR
- —
- Eligible?
- —
Personal DTI + credit; lowest rate.
DSCR
20% down · 8.5% · 30yr
- Down + closing
- —
- Monthly P&I
- —
- Monthly cashflow
- —
- DSCR
- —
- Eligible?
- —
No personal income docs; deal must DSCR.
Hard money
10% down · 12.0% · 12mo
- Down + closing
- —
- Monthly P&I
- —
- Monthly cashflow
- —
- DSCR
- —
- Eligible?
- —
Short-term bridge; refi at stabilization.
Rent comps 19 comps
| Address | Beds | Baths | Sqft | Rent | $/sqft | DOM | Units | Dist |
|---|---|---|---|---|---|---|---|---|
| 7125 N Lagoon Dr Panama City, FL | 2.0 | 2.5 | 1250 | $2,000 | $1.60 | 21d | 1 | 0.02mi |
| 7813 N Lagoon Dr Panama City, FL | 2.0 | 2.0 | 1060 | $1,900 | $1.79 | 21d | 1 | 0.23mi |
| 447 Water Oak Cir Panama City, FL | 2.0 | 2.0 | 980 | $1,800 | $1.84 | 21d | 1 | 0.28mi |
| 6427 Sunset Ave Unit 2 Panama City, FL | 2.0 | 1.0 | 900 | $1,225 | $1.36 | 21d | 1 | 0.51mi |
| 2103 Bent Oak Ct Panama City, FL | 3.0 | 2.0 | 1000 | $1,800 | $1.80 | 21d | 1 | 0.54mi |
| 2340 Grand Oaks Ln Unit 1523381P Panama City Beach, FL | 2.0 | 1.0 | 1001 | $4,240 | $4.24 | 13d | 1 | 0.55mi |
| 7205 Thomas Dr Unit 1354970P Panama City Beach, FL | 2.0 | 2.0 | 1044 | $3,227 | $3.09 | 21d | 1 | 0.56mi |
| 7405A Beach Dr Unit 1355031P Panama City Beach, FL | 2.0 | 2.0 | 1291 | $2,124 | $1.65 | 21d | 1 | 0.59mi |
| 2617 Cypress St Panama City, FL | 1.0 | 1.0 | 720 | $1,300 | $1.81 | 21d | 1 | 0.73mi |
| 2519 Beech St Panama City, FL | 2.0 | 1.5 | 1200 | $1,595 | $1.33 | 21d | 1 | 0.76mi |
| 5931 Pinetree Ave Panama City, FL | 2.0 | 1.0 | 900 | $1,600 | $1.78 | 21d | 1 | 0.84mi |
| 6219 Poinciana Dr Panama City, FL | 2.0 | 2.0 | 1214 | $2,350 | $1.94 | 21d | 1 | 0.88mi |
| 5710 Sunset Ave Unit 1523314P Panama City Beach, FL | 2.0 | 2.0 | 1087 | $8,246 | $7.59 | 21d | 1 | 1.06mi |
| 5409 Hilltop Ave Panama City, FL | 2.0 | 1.0 | 800 | $1,300 | $1.62 | 21d | 1 | 1.29mi |
| 8730 Thomas Dr Unit 1355041P Panama City Beach, FL | 1.0 | 1.0 | 839 | $1,373 | $1.64 | 21d | 1 | 1.42mi |
| 5230 Beach Dr Unit D Panama City, FL | 1.0 | 1.0 | 900 | $1,200 | $1.33 | 21d | 1 | 1.43mi |
| 5230 Beach Dr Unit A Panama City, FL | 1.0 | 1.0 | 900 | $1,250 | $1.39 | 21d | 1 | 1.43mi |
| 2526 Laurie Ave Panama City, FL | 2.0 | 2.0 | 950 | $1,750 | $1.84 | 13d | 1 | 1.47mi |
| 8715 Surf Dr Unit 1523323P Panama City Beach, FL | 2.0 | 2.0 | 1194 | $5,377 | $4.50 | 13d | 1 | 1.49mi |
HOA detail condo
- Monthly dues
- $0 · $0/yr
- Likely covers
- pool
- Assessments
- None detected in remarks — confirm with the listing agent.
Listing history 50 events
-
2026-06-19days on market $220,000 Active 25 DOM
-
2026-06-18days on market $220,000 Active 24 DOM
-
2026-06-17days on market $220,000 Active 23 DOM
-
2026-06-16days on market $220,000 Active 22 DOM
-
2026-06-15days on market $220,000 Active 21 DOM
-
2026-06-14days on market $220,000 Active 19 DOM
-
2026-06-13days on market $220,000 Active 18 DOM
-
2026-06-10days on market $220,000 Active 16 DOM
-
2026-06-09days on market $220,000 Active 15 DOM
-
2026-06-08days on market $220,000 Active 14 DOM
-
2026-06-07days on market $220,000 Active 13 DOM
-
2026-06-05days on market $220,000 Active 10 DOM
-
2026-06-03days on market $220,000 Active 9 DOM
-
2026-06-02days on market $220,000 Active 8 DOM
-
2026-06-01days on market $220,000 Active 7 DOM
-
2026-05-31days on market $220,000 Active 6 DOM
-
2026-05-30days on market $220,000 Active 5 DOM
-
2026-05-25price $220,000
-
2026-05-25$200,000 Active
-
2026-05-13historical
-
2026-04-21price $225,000
-
2026-04-21price $225,000
-
2026-02-03price $229,000
-
2026-02-03price $229,000
-
2025-11-15price $235,000
-
2025-11-14$235,000 Active
-
2025-11-14$248,000 Active
-
2023-03-31historical
-
2023-03-31historical
-
2023-03-13status Active
-
2023-03-06status Active
-
2023-03-06status Active
-
2023-02-05status Pending
-
2023-01-31status Active
-
2023-01-28historical Active Under Contract
-
2023-01-25status Pending
-
2022-12-05status Pending
-
2022-12-05status Pending
-
2022-12-05historical
-
2022-12-05historical Active Under Contract
-
2022-11-15$224,900 Active
-
2022-11-11$224,900 Active
-
2022-11-11$224,900 Active
-
2022-11-03historical
-
2022-09-23price $218,900
-
2022-08-30price $225,000
-
2022-07-26$229,000 Active
-
2021-12-14historical
-
2021-12-10soldstatus $200,000
-
2021-09-27$215,000
ⓘ Source: listings_history table (triggers on properties + properties_extension) + one-shot
backfill from property_details.listing_events for pre-trigger history.
Climate risk First Street
- Flood 6/10 Major FEMA zone X (unshaded) · 72% chance over 30 yrs
- Wildfire 1/10 Low
- Heat 10/10 Extreme 7 d/yr ≥106°F today · 21 d/yr by 30 yrs out
- Wind 9/10 Extreme 99% chance of damaging wind over 30 yrs
- Air quality 1/10 Low 0 unhealthy d/yr today · 0 by 30 yrs out
Nearby sold comps map
Loading sold comps map…
Walkable amenities ~0.75 mi
Loading nearby amenities…
Taxation est. · year 1
- Rental income
- $22,701
- − Mortgage interest
- −$12,323
- − Property taxes
- −$3,300
- − Insurance
- −$1,100
- − Repairs & maintenance
- −$1,816
- − Management
- −$1,816
- − Depreciation
- −$6,400
- Taxable loss
- −$4,055
- Est. tax savings @ 24.0%
- +$973
- After-tax cash flow
- $662/yr
For passive investors: Depreciation is non-cash, so a rental often shows a tax loss while cash-flowing — sheltering income. Rental losses are passive: they offset passive income freely, and up to $25,000/yr can offset ordinary (W-2) income if you actively participate and your MAGI is under $100k (phasing out to $0 by $150k); unused losses carry forward. On sale, claimed depreciation is recaptured at up to 25%, and gains may owe capital-gains tax (a 1031 exchange can defer both). Figures are a year-1 estimate at your 24.0% rate — not tax advice; consult a CPA.
Condition & rehab AI · 12 photos
This ground-floor condo unit is in good condition with minor cosmetic updates needed. It offers a split-bedroom layout and an open-concept living area with a private courtyard-style side yard. The well-maintained complex offers a community pool and ample parking, making it an ideal short-term rental opportunity.
Repairs flagged
- Minor Kitchen cabinets — Dated cabinetry
- Minor Kitchen appliances — Dated appliances
- Minor Bathroom fixtures — Dated fixtures
Value-add opportunities
- Resale Paint exterior siding — Enhances curb appeal and value
- Resale Replace kitchen cabinets and appliances — Modernizes kitchen and adds value
- Resale Upgrade bathroom fixtures — Enhances bathroom aesthetics and value
Renovation cost estimate screening
| Repair item | Severity | Est. cost |
|---|---|---|
| Kitchen cabinets · Dated cabinetry | Minor | $500–3,000 |
| Kitchen appliances · Dated appliances | Minor | $500–3,000 |
| Bathroom fixtures · Dated fixtures | Minor | $500–3,000 |
| Total estimated repair cost · 3 items | $1,500–9,000 |
Value-add ROI direction
- Resale Paint exterior siding — Enhances curb appeal and value ↑
- Resale Replace kitchen cabinets and appliances — Modernizes kitchen and adds value ↑
- Resale Upgrade bathroom fixtures — Enhances bathroom aesthetics and value ↑
ⓘ Cost ranges are severity-bucket heuristics (US national rule-of-thumb). Get contractor quotes + a written scope before underwriting a rehab budget.
Schools (NCES district)
- District
- Bay
- NCES district ID
- 1200090
- Math proficiency
- 51% ▼ -8.00%
- Reading proficiency
- 51% ▼ -7.00%
- Median HH income
- $47,740
- Composite
- 43.41/100
- National rank
- #3014
- State rank
- #29 of 73 in FL
Livability — Upper Grand Lagoon
- Score
- 67/100
- State rank
- #583
- US rank
- #11085
Category grades
Schools grade is shown separately in the Schools card above.
Census & demographics
- Census place
- Upper Grand Lagoon, FL
- County
- Bay County · 163,593 people
- City population
- 18,326
- Metro
- Panama City, FL
- Population (ZIP)
- 18,832
- Household income
- $80,822
- Rent vs Own
- Severe rent burden
- 817.0
Population outlook (Bay County) Hauer SSP2
- Today (2025)
- 206,264 people
- By 2030
- 217,740 · +5.6%
- By 2040
- 238,738 · +15.7%
- By 2050
- 255,545 · +23.9%
- By 2075
- 288,295 · +39.8%
- By 2100
- 288,638 · +39.9%
Race, ethnicity, and origin ACS 2023
- Neighborhood character
- Predominantly White (81%)
- Race & ethnicity
- White 81% Hispanic / Latino 7% Two or more races 6% Black 3% Asian 2%
- Hispanic origin (detail)
- Mexican 2% Puerto Rican 2%
- Common ancestry
- Romanian 4% Lithuanian 4% Italian 2%
- Foreign-born
- 11% · Canada, South Korea
- Languages at home
- 88% English-only · Spanish 5% Russian/Polish/Slavic 4% Tagalog/Filipino 1%
Political lean MEDSL · Bay
- 2024 margin
- Solid R (+47.4) · D 25.8% · R 73.1% · Other 1.1%
- 2008→2024 swing
- -6.6pp toward R · 2008: -40.7pp · 2024: -47.4pp
- All cycles
- 2024: R+47.4 2020: R+43.5 2016: R+46.3 2012: R+43.6 2008: R+40.7
Not yet ingested
- Civics
- —
Market trends
- HPI YoY
- ▼ -202.52%
- Current HPI
- 246.9126
- Rent YoY
- ▲ 2.55%
- Metro
- Panama City, FL
- State GDP YoY
- ▲ 3.28%
- F500 in state
- 36
Industry mix (Fortune 500 HQ in FL)
| Industry | F500 HQs | Revenue |
|---|---|---|
| Industrial Technology | 2 | $29B |
|
||
| Insurance | 2 | $17B |
|
||
| Retail | 1 | $60B |
|
||
| Technology Distribution | 1 | $58B |
|
||
| Homebuilding | 1 | $35B |
|
||
| Technology Manufacturing | 1 | $35B |
|
||
Price history
+241.1% since first listed34 events — show timeline
- 2026-05-25 Price Changed $220,000 CPARMLS
- 2026-05-25 Listed $200,000 CPARMLS
- 2026-05-13 Listing Removed — CPARMLS
- 2026-04-21 Price Changed $225,000 ECAR
- 2026-04-21 Price Changed $225,000 CPARMLS
- 2026-02-03 Price Changed $229,000 ECAR
- 2026-02-03 Price Changed $229,000 CPARMLS
- 2025-11-15 Price Changed $235,000 CPARMLS
- 2025-11-14 Listed $248,000 CPARMLS
- 2025-11-14 Listed $235,000 ECAR
- 2023-03-31 Delisted — ECAR
- 2023-03-31 Listing Removed — CPARMLS
- 2023-03-13 Relisted — CPARMLS
- 2023-03-06 Relisted — ECAR
- 2023-03-06 Relisted — NAMLS
- 2023-02-05 Pending — CPARMLS
- 2023-01-31 Relisted — CPARMLS
- 2023-01-28 Contingent — CPARMLS
- 2023-01-25 Pending — CPARMLS
- 2022-12-05 Pending — NAMLS
- 2022-12-05 Pending — ECAR
- 2022-12-05 Listing Removed — NAMLS
- 2022-12-05 Contingent — CPARMLS
- 2022-11-15 Listed $224,900 ECAR
- 2022-11-11 Listed $224,900 NAMLS
- 2022-11-11 Listed $224,900 CPARMLS
- 2022-11-03 Delisted — ECAR
- 2022-09-23 Price Changed $218,900 ECAR
- 2022-08-30 Price Changed $225,000 ECAR
- 2022-07-26 Listed $229,000 ECAR
- 2021-12-14 Listing Removed — CPARMLS
- 2021-12-10 Sold (MLS) $200,000 CPARMLS
- 2021-09-27 Listed $215,000 CPARMLS
- 2011-06-29 Listed $64,500 CPARMLS
Cash-flow waterfall
monthlySold comps — $/sqft
last 12 mo · ≤1 miLoading sold comps…