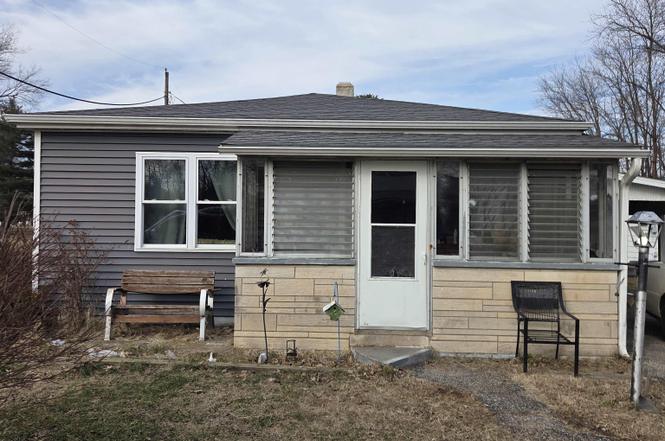
411 Matilda St · Elnora, IN
Flood risk 3/10 · Minor
- FEMA flood zone
- —
- Chance of flooding over 30 yrs
- 0.2%
- Est. flood insurance / yr
- —
Fire risk 1/10 · Minimal
- Est. fire insurance / yr
- $717 – $1,331
Heat risk 4/10 · Minor
- Hot days now (above 106°F)
- 7 days/yr
- Hot days in 30 yrs
- 19 days/yr
Wind risk 2/10 · Minimal
- Chance of severe wind over 30 yrs
- 2.0%
Air-quality risk 3/10 · Minor
- Unhealthy air days now
- 2 days/yr
- Unhealthy air days in 30 yrs
- 3 days/yr
Risk factors via First Street. Map © Google.
Why this score? — see what drove the B- grade
The composite is a weighted blend of 9 inputs, each scored 0–100. Each bar is that input's sub-score; the figure is the points it added to the 100-point composite (weight × sub-score).
- Cash flow +25.3/30.0
- DSCR +8.3/10.0
- Appreciation +8.3/10.0
- ARV discount +7.5/15.0
- 1% rule +5.8/10.0
- Schools +3.3/10.0
- Livability +3.2/5.0
- Rent growth +2.5/5.0
- Condition / age +2.5/5.0
$79,900
🖨 Deal sheet 📄 Offer letter ✓ Due diligence
Listing remarks
Great investment property or starter home in Elnora Indiana! Home features paved driveway, covered parking and has some valuable upgrades already, just needs your finishing touches. Update! Now has a brand new mini split unit for heat and a/c.
Key facts
- 4,356 sq ft lot
- Built 1953
- Listed 64 days
Property features AI
Finance
- Other: Directions: From HWY 57, turn north on Spriger St and East Matilda St; house will be on left
- Financial info: Annual tax amount: $605
Exterior
- Utilities: Public water; Public sewer
- Home design: Single-family site-built home; One story
- Construction: Vinyl siding; 856 above-grade finished square feet
- Exterior features: Level lot; Lot dimensions approximately 100' x 50'
Interior
- Bedrooms: Total rooms: 4; Laundry on main level
- Bathrooms: 1 full bathroom (main level)
- Heating & cooling: Has cooling (type: Other)
- Interior features: Crawl space basement
- Laundry & utility: Main-level laundry
Neighborhood map
What this means for you Summary
Snapshot
- This is a 2-bed/1.0-bath single-family listed at $80k.
Deal economics
- At list price, monthly cash flow is $181 ($2k/yr) — positive.
- The deal already cash-flows at list — no discount required.
- Meets the 1% rule at list price ($859 rent vs $80k).
- Recommended offer: $75k (6.0% below list) — sets the bar for market timing.
Location & tenants
- Location reads 63/100 on livability (#422 in IN) — a middle-class / working-renter tenant base. Strengths: cost of living A+, housing A+; Watch: employment C-, health & safety C-, crime D+.
- North Daviess Community Schools (rural): math 32% / reading 46% proficiency, ranked #157 of 301 in IN (top 52%) — families likely to look elsewhere, expect single-tenant / working-renter base with shorter leases.
- Zoned schools: North Daviess Elementary School (math 37% / reading 44%, grade F, #491 of 994 statewide, top 50%, 637 students, 48% FRL); North Daviess Jr-Sr High School (math 26% / reading 48%, grade F, #247 of 369 statewide, top 70%, 471 students, 49% FRL) — zoned schools average 49% FRL vs 31% district-wide (18 pts higher); higher-poverty schools than district average — tighter screening recommended.
- Market conditions: 6 active listings in the ZIP; 71 units permitted in Daviess County in 2024 (0 in 5+ unit buildings).
Forward outlook
- In year one you build about $6k of equity ($552 loan paydown + $5k appreciation (6.6% local appreciation)).
- Daviess County population projected at +6% by 2050 — modest demand growth; plan on rents tracking national, not racing it.
- At projected returns (6.6% appreciation + 3.0% rent growth), your $22k cash investment doubles in ~3 years — after that, you're playing with house money.
- By year 6, paydown + projected appreciation supports a ~$32k cash-out refi (75% LTV) — recoverable capital for the next deal without selling this one.
Negotiation context
- It's been on market 65 days — a 6% lower offer ($75k) is reasonable based on typical stale-listing flexibility.
- 3 sale attempts; this cycle's ask has dropped $9k (10%) from the opening price — seller is motivated, your offer sets the floor, not the list.
Risks & watch-outs
- Watch-outs: built in 1953 — expect roof / HVAC / electrical / plumbing capex.
Questions for the listing agent
- It's been on market 65 days. Have you received any prior offers? Is the seller open to a 6% concession, seller financing, or rate buy-down credit?
- Built in 1953 — when were the roof, HVAC, electrical panel, plumbing, and water heater last replaced?
- Why hasn't it sold? Are there any deal-killer items the seller is aware of (foundation, flood, title, zoning, code violations)?
- Is there a deadline driving the sale (1031 exchange, divorce, estate, relocation)? That informs how much negotiation room exists.
- Schools are D-rated, which usually means shorter tenancies and higher turnover. Who's the typical renter profile here, and what's been the actual vacancy rate?
- Crime grade is D in this area — have there been break-ins, vandalism, or insurance claims at this property in the last 3 years? What carrier currently insures it and at what premium?
- What's the average days-on-market for RENTAL listings here right now (not sales)? A rising rental-DOM trend means longer vacancies and softer asking-rent achievability than the comps imply.
- What's the recent tenant-quality profile in this submarket — average credit score on applications, eviction rate, late-payment / NSF rate, and stable-employment percentage? A property-management company in the area should have these aggregated.
- How much new for-sale + rental construction is in the pipeline within 1–3 miles? Heavy new supply typically softens prices + rents 12–24 months out; constrained supply supports both.
Investment metrics
- 1% rule
- 1.08% ✓
- Cap rate
- 9.00%
- Cash-on-cash
- 9.68%
- DSCR
- 1.43
- GRM
- 7.8
CMA / ARV
- ARV (on-the-fly)
- $42,800
- Comps found
- 2
Show comp detail 2 sales within ~0.75 mi
| Address | Dist | Beds/Ba | Sqft | Sold | Price | $/sf | Match |
|---|---|---|---|---|---|---|---|
| 214 S East St | 0.20mi | 2/1.0 | 924 (+8%) | 18mo | $35,000 | $38 | 62 |
| 528 3rd St | 0.57mi | 2/1.0 | 912 (+6%) | 20mo | $45,900 | $50 | 46 |
Match score weights: distance 35% · size 25% · config 20% · recency 20%. Top-matched comps best support the ARV.
Projected returns pro-forma
6.61% appreciation · 3.0% rent growth · sell at horizon
- IRR
- 24.6%
- Equity multiple
- 2.68×
- Total profit
- $37,480
- Equity at exit
- $53,348
- IRR
- 22.9%
- Equity multiple
- 5.49×
- Total profit
- $100,537
- Equity at exit
- $99,558
Cash invested: $22,372 (down + closing). Projections, not guarantees.
Landlord ↔ Tenant lean methodology
- Overall (STATE)
- 90 Strongly Landlord-Friendly
- State Indiana
- 90 Strongly Landlord-Friendly · R+11
- County
- — inherits STATE
- City
- — inherits STATE
ZIP-level market 47529
- Home prices YoY
- 3.0%
- Active inventory
- 6
- Price-to-rent
- 7.8×
Monthly cashflow live
- Estimated rent
- $859 medium interval (Pro) →
- Mortgage (P&I)
- −$419
- Tax from tax record
- −$46 /mo · $550/yr
- Insurance
- −$33
- HOA
- −$0
- Vacancy / Maint / Mgmt
- −$180
- Net cashflow
- $181
Break-even live
UW: 25.0% down · 7.5% · 30yr · 1.5% tax · 5.0% vac · 8.0% maint · 8.0% mgmt
Financing live
Cash to close
- Down payment
- $19,975
- Closing costs
- $2,397
- Reserves months
- —
- Total cash needed
- —
Loan-product check · same deal, 3 products live
Conventional
25% down · 7.5% · 30yr
- Down + closing
- —
- Monthly P&I
- —
- Monthly cashflow
- —
- DSCR
- —
- Eligible?
- —
Personal DTI + credit; lowest rate.
DSCR
20% down · 8.5% · 30yr
- Down + closing
- —
- Monthly P&I
- —
- Monthly cashflow
- —
- DSCR
- —
- Eligible?
- —
No personal income docs; deal must DSCR.
Hard money
10% down · 12.0% · 12mo
- Down + closing
- —
- Monthly P&I
- —
- Monthly cashflow
- —
- DSCR
- —
- Eligible?
- —
Short-term bridge; refi at stabilization.
Listing history 24 events
-
2026-06-18days on market $79,900 Active 65 DOM
-
2026-06-17days on market $79,900 Active 64 DOM
-
2026-06-16days on market $79,900 Active 63 DOM
-
2026-06-15days on market $79,900 Active 62 DOM
-
2026-06-13days on market $79,900 Active 60 DOM
-
2026-06-12days on market $79,900 Active 59 DOM
-
2026-06-09days on market $79,900 Active 56 DOM
-
2026-06-08days on market $79,900 Active 55 DOM
-
2026-06-07days on market $79,900 Active 54 DOM
-
2026-06-07days on market $79,900 Active 53 DOM
-
2026-06-04days on market $79,900 Active 50 DOM
-
2026-06-02days on market $79,900 Active 49 DOM
-
2026-06-01days on market $79,900 Active 48 DOM
-
2026-05-31days on market $79,900 Active 47 DOM
-
2026-05-31days on market $79,900 Active 46 DOM
-
2026-05-01price $79,900
-
2026-05-01status Active
-
2026-04-10status Pending
-
2026-04-09price $83,000
-
2026-04-06price $88,000
-
2026-04-06status Active
-
2026-03-04status Pending
-
2026-02-21$89,000 Active
-
2026-02-17historical $89,000
ⓘ Source: listings_history table (triggers on properties + properties_extension) + one-shot
backfill from property_details.listing_events for pre-trigger history.
Tax reassessment forecast IN · Partial reset (capped growth)
- Current annual tax
- $550 · $46/mo
- Projected year-2 tax
- $615 · $51/mo
- Expected delta
- +$65/yr (+$5/mo · 11.7%)
ⓘ Screening estimate from a state-policy table — verify with the county assessor before closing.
Climate risk First Street
- Flood 3/10 Moderate 20% chance over 30 yrs
- Wildfire 1/10 Low
- Heat 4/10 Moderate 7 d/yr ≥106°F today · 19 d/yr by 30 yrs out
- Wind 2/10 Low 2% chance of damaging wind over 30 yrs
- Air quality 3/10 Moderate 2 unhealthy d/yr today · 3 by 30 yrs out
Nearby sold comps map
Loading sold comps map…
Walkable amenities ~0.75 mi
Loading nearby amenities…
Taxation est. · year 1
- Rental income
- $10,309
- − Mortgage interest
- −$4,476
- − Property taxes
- −$550
- − Insurance
- −$400
- − Repairs & maintenance
- −$825
- − Management
- −$825
- − Depreciation
- −$2,324
- Taxable income
- $910
- Est. tax owed @ 24.0%
- −$218
- After-tax cash flow
- $1,948/yr
For passive investors: Depreciation is non-cash, so a rental often shows a tax loss while cash-flowing — sheltering income. Rental losses are passive: they offset passive income freely, and up to $25,000/yr can offset ordinary (W-2) income if you actively participate and your MAGI is under $100k (phasing out to $0 by $150k); unused losses carry forward. On sale, claimed depreciation is recaptured at up to 25%, and gains may owe capital-gains tax (a 1031 exchange can defer both). Figures are a year-1 estimate at your 24.0% rate — not tax advice; consult a CPA.
Schools (NCES district)
- District
- North Daviess Community Schools
- NCES district ID
- 1807710
- Math proficiency
- 32% ▼ -17.00%
- Reading proficiency
- 46% ▼ -11.00%
- Median HH income
- $45,197
- Composite
- 33.15/100
- National rank
- #5552
- State rank
- #157 of 301 in IN
Livability — Elnora
- Score
- 63/100
- State rank
- #422
- US rank
- #15217
Category grades
Schools grade is shown separately in the Schools card above.
Census & demographics
- Census place
- Elnora, IN
- Population (ZIP)
- 1,140
Population outlook (Daviess County) Hauer SSP2
- Today (2025)
- 33,940 people
- By 2030
- 34,457 · +1.5%
- By 2040
- 35,412 · +4.3%
- By 2050
- 35,803 · +5.5%
- By 2075
- 35,173 · +3.6%
- By 2100
- 29,799 · -12.2%
Race, ethnicity, and origin ACS 2023
- Neighborhood character
- Predominantly White (98%)
- Race & ethnicity
- White 98%
- Common ancestry
- Lithuanian 4% Slovak 3% Serbian 2%
- Languages at home
- 80% English-only · German/W. Germanic 20%
Political lean MEDSL · Daviess
- 2024 margin
- Solid R (+64.3) · D 17.1% · R 81.5% · Other 1.4%
- 2008→2024 swing
- -29.1pp toward R · 2008: -35.2pp · 2024: -64.3pp
- All cycles
- 2024: R+64.3 2020: R+62.0 2016: R+62.8 2012: R+50.8 2008: R+35.2
Not yet ingested
- Civics
- —
Market trends
- HPI YoY
- ▲ 6.61%
- Current HPI
- 230.1335
- Rent YoY
- —
- Metro
- —
- State GDP YoY
- ▲ 2.90%
- F500 in state
- 18
Industry mix (Fortune 500 HQ in IN)
| Industry | F500 HQs | Revenue |
|---|---|---|
| Industrial Machinery | 2 | $37B |
|
||
| Healthcare | 1 | $177B |
|
||
| Pharmaceuticals | 1 | $45B |
|
||
| Metals / Steel | 1 | $18B |
|
||
| Agriculture | 1 | $17B |
|
||
| Packaging | 1 | $12B |
|
||
Price history
-10.2% since first listed9 events — show timeline
- 2026-05-01 Price Changed $79,900 IRMLS
- 2026-05-01 Relisted — IRMLS
- 2026-04-10 Pending — IRMLS
- 2026-04-09 Price Changed $83,000 IRMLS
- 2026-04-06 Price Changed $88,000 IRMLS
- 2026-04-06 Relisted — IRMLS
- 2026-03-04 Pending — IRMLS
- 2026-02-21 Listed $89,000 IRMLS
- 2026-02-17 Coming Soon $89,000 IRMLS
Property tax history
-0.5%/yrLatest (2024): $550 · -1.1% YoY. Source: county tax records.
Cash-flow waterfall
monthlySold comps — $/sqft
last 12 mo · ≤1 miLoading sold comps…