699 N Vulcan Ave #56 · Encinitas, CA
Flood risk 1/10 · Minimal
- FEMA flood zone
- X (unshaded)
- Chance of flooding over 30 yrs
- 0.0%
- Est. flood insurance / yr
- $507 – $1,088
Fire risk 1/10 · Minimal
- Est. fire insurance / yr
- $659 – $1,223
Heat risk 4/10 · Minor
- Hot days now (above 84°F)
- 7 days/yr
- Hot days in 30 yrs
- 18 days/yr
Wind risk 1/10 · Minimal
- Chance of severe wind over 30 yrs
- —
Air-quality risk 3/10 · Minor
- Unhealthy air days now
- 4 days/yr
- Unhealthy air days in 30 yrs
- 4 days/yr
Risk factors via First Street. Map © Google.
Why this score? — see what drove the B- grade
The composite is a weighted blend of 9 inputs, each scored 0–100. Each bar is that input's sub-score; the figure is the points it added to the 100-point composite (weight × sub-score).
- Cash flow +30.0/30.0
- 1% rule +10.0/10.0
- DSCR +10.0/10.0
- Schools +7.1/10.0
- Livability +4.0/5.0
- Rent growth +3.8/5.0
- Condition / age +2.5/5.0
- ARV discount +2.1/15.0
- Appreciation +0.0/10.0
$184,999
🖨 Deal sheet 📄 Offer letter ✓ Due diligence
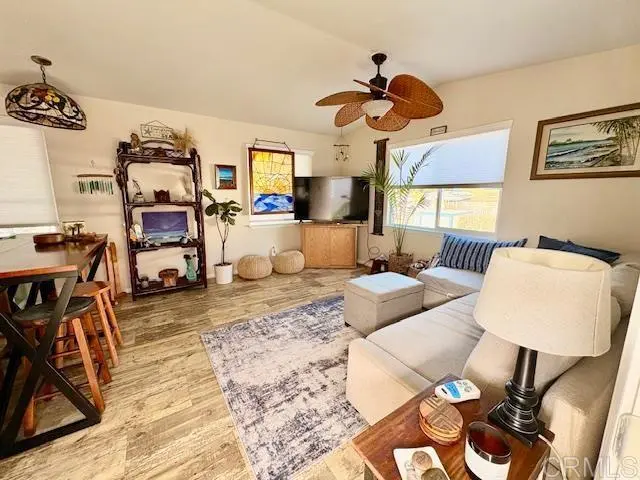
Listing remarks
Welcome to Riviera Mobile Home Park in the heart of Leucadia. This immaculate 1-bedroom/1 bath residence offers 560 square feet of comfortable living space. The open layout feels spacious and inviting. Large shed is included for storage or use as a workshop. Just blocks from multiple beach access points and all the shops, dining, and charm that Leucadia is known for, the location is unbeatable. Riviera Mobile Home Park also features desirable community amenities, including a clubhouse, game room, and sparkling pool. A true turnkey opportunity, ideal for a primary residence or coastal retreat. Call now! SN: DJ710104Z
Key facts
- Clubhouse
- Community amenities
- Beach access points
Tags
Property features AI
Finance
- Other: Lot size estimated; Lot dimensions listed as 1800 (source estimated)
- Financial info: Assessments: Unknown
- HOA & community: Land lease community (Riviera); Monthly land lease: $2,030; Community features: biking, hiking; Manager approval required; Pets allowed
Exterior
- Parking: Carport; Two parking spaces (includes 2 carport spaces); Park name: Riviera
- Utilities: Electricity connected
- Home design: Single-story mobile home (Pineridge model); Mobile home remains on site; Turnkey condition; Facing/has a view; Entry on main level
- Construction: Composition roof; Mobile home, approximately 14' x 40'
- Exterior features: Community pool; Park nearby; Lot level/flat; One storage shed
Interior
- Kitchen: Gas cooking; Garbage disposal; Microwave; Refrigerator; Free‑standing range; Water heater unit
- Bedrooms: All bedrooms on ground level
- Flooring: Laminate flooring
- Bathrooms: Walk-in shower; Shower (standard)
- Heating & cooling: Forced air heating; Central cooling
- Interior features: Ceiling fan; One-level layout; Entry on main level
- Laundry & utility: Inside laundry room; Individual laundry room; Washer hookup; Utility room
Neighborhood map
What this means for you Summary
Snapshot
- This is a 1-bed/1.0-bath manufactured listed at $185k.
Deal economics
- At list price, monthly cash flow is $1k ($13k/yr) — positive.
- The deal already cash-flows at list — no discount required.
- Meets the 1% rule at list price ($3k rent vs $185k).
- Recommended offer: $174k (6.0% below list) — sets the bar for market timing.
- Cap rate 13.4% vs local median 1.6% in Encinitas — top-decile yield for the area; either an underpriced asset or a hidden risk that comps aren't pricing in. Stress-test before assuming the spread holds.
Location & tenants
- Location reads 79/100 on livability (#54 in CA, #2,026 nationally) — a middle-class / working-renter tenant base. Strengths: schools A+, amenities A+, commute A+; Watch: health & safety C-, cost of living F.
- San Dieguito Union High (urban): math 72% / reading 79% proficiency, ranked #56 of 1,400 in CA (top 4%) — strong family-tenant draw, lease renewals of 3-5y typical; only 8% free/reduced lunch — higher-income household profile.
- Market conditions: Rents rising fast (+5.4%/yr); 205 active listings in the ZIP; 6 comparable units currently listed for rent nearby; rentals leasing fast (median 2d on market — plan ~1-2 weeks tenant-placement turnaround); high-income renter base; 11,759 units permitted in San Diego County in 2024 (7,244 in 5+ unit buildings).
Forward outlook
- Local home prices are declining (-3.0%/yr); year-one equity from $1k of loan paydown is wiped out by about $6k of value loss. Plan a longer hold.
- San Diego County population projected at +20% by 2050 — long-run rental-demand tailwind backs the buy-and-hold thesis.
- At projected returns (-3.0% appreciation + 5.4% rent growth), your $52k cash investment doubles in ~5 years — after that, you're playing with house money.
Negotiation context
- It's been on market 65 days — a 6% lower offer ($174k) is reasonable based on typical stale-listing flexibility.
Questions for the listing agent
- It's been on market 65 days. Have you received any prior offers? Is the seller open to a 6% concession, seller financing, or rate buy-down credit?
- Why hasn't it sold? Are there any deal-killer items the seller is aware of (foundation, flood, title, zoning, code violations)?
- Is there a deadline driving the sale (1031 exchange, divorce, estate, relocation)? That informs how much negotiation room exists.
- Schools are A-rated — typically a magnet for longer-tenancy family renters. What's the average tenant stay here, and is there a school-zone premium baked into asking?
- What's the average days-on-market for RENTAL listings here right now (not sales)? A rising rental-DOM trend means longer vacancies and softer asking-rent achievability than the comps imply.
- What's the recent tenant-quality profile in this submarket — average credit score on applications, eviction rate, late-payment / NSF rate, and stable-employment percentage? A property-management company in the area should have these aggregated.
- How much new for-sale + rental construction is in the pipeline within 1–3 miles? Heavy new supply typically softens prices + rents 12–24 months out; constrained supply supports both.
Investment metrics
- 1% rule
- 1.62% ✓
- Cap rate
- 13.37%
- Cash-on-cash
- 25.29%
- DSCR
- 2.13
- GRM
- 5.1
CMA / ARV
- ARV (on-the-fly)
- $165,072
- Comps found
- 3
Show comp detail 3 sales within ~0.75 mi
| Address | Dist | Beds/Ba | Sqft | Sold | Price | $/sf | Match |
|---|---|---|---|---|---|---|---|
| 699 N Vulcan Ave #43 | 0.00mi | 1/1.0 | 560 (+3%) | 19mo | $170,000 | $304 | 79 |
| 699 N Vulcan Ave #73 | 0.04mi | 1/1.0 | 504 (-7%) | 19mo | $150,000 | $298 | 70 |
| 123 Jasper St #16 | 0.31mi | 2/1.0 (+1) | 600 (+10%) | 2mo | $405,000 | $675 | 61 |
Match score weights: distance 35% · size 25% · config 20% · recency 20%. Top-matched comps best support the ARV.
Projected returns pro-forma
-3.0% appreciation · 5.39% rent growth · sell at horizon
- IRR
- 21.5%
- Equity multiple
- 1.91×
- Total profit
- $46,982
- Equity at exit
- $27,584
- IRR
- 31.2%
- Equity multiple
- 4.14×
- Total profit
- $162,456
- Equity at exit
- $15,995
Cash invested: $51,800 (down + closing). Projections, not guarantees.
Landlord ↔ Tenant lean methodology
- Overall (STATE)
- 18 Strongly Tenant-Friendly
- State California
- 18 Strongly Tenant-Friendly · D+13
- County
- — inherits STATE
- City
- — inherits STATE
ZIP-level market 92024
- Rents YoY
- 5.4%
- Active inventory
- 205
- Price-to-rent
- 5.1×
Monthly cashflow live
- Estimated rent
- $3,000 high interval (Pro) →
- Mortgage (P&I)
- −$970
- Tax est. 1.5%
- −$231 /mo · $2,775/yr
- Insurance
- −$77
- HOA
- −$0
- Vacancy / Maint / Mgmt
- −$630
- Net cashflow
- $1,092
Break-even live
UW: 25.0% down · 7.5% · 30yr · 1.5% tax · 5.0% vac · 8.0% maint · 8.0% mgmt
Financing live
Cash to close
- Down payment
- $46,250
- Closing costs
- $5,550
- Reserves months
- —
- Total cash needed
- —
Loan-product check · same deal, 3 products live
Conventional
25% down · 7.5% · 30yr
- Down + closing
- —
- Monthly P&I
- —
- Monthly cashflow
- —
- DSCR
- —
- Eligible?
- —
Personal DTI + credit; lowest rate.
DSCR
20% down · 8.5% · 30yr
- Down + closing
- —
- Monthly P&I
- —
- Monthly cashflow
- —
- DSCR
- —
- Eligible?
- —
No personal income docs; deal must DSCR.
Hard money
10% down · 12.0% · 12mo
- Down + closing
- —
- Monthly P&I
- —
- Monthly cashflow
- —
- DSCR
- —
- Eligible?
- —
Short-term bridge; refi at stabilization.
Rent comps 6 comps
| Address | Beds | Baths | Sqft | Rent | $/sqft | DOM | Units | Dist |
|---|---|---|---|---|---|---|---|---|
| 925 N Vulcan Ave Encinitas, CA | 1.0 | 1.0 | 590 | $2,872 | $4.87 | 24d | 2 | 0.22mi |
| 1075 N Vulcan Ave Unit 05 Encinitas, CA | 1.0 | 1.0 | 550 | $2,471 | $4.49 | 1d | 1 | 0.40mi |
| 1435 N Vulcan Ave Apt 9 Encinitas, CA | 1.0 | 1.0 | 750 | $2,995 | $3.99 | 7d | 1 | 0.75mi |
| 1967 N Vulcan Ave Encinitas, CA | 1.0–2.0 | 1.0–2.0 | 929 | $3,895 | $4.19 | 1d | 7 | 1.42mi |
| 116 Quail Gardens Dr Encinitas, CA | 1.0 | 1.0 | 540 | $2,612 | $4.84 | 1d | 3 | 1.49mi |
| 810 3rd St Encinitas, CA | 1.0 | 1.0 | 650 | $2,695 | $4.15 | 1d | 1 | 1.49mi |
Listing history 16 events
-
2026-06-18days on market $184,999 Active 65 DOM
-
2026-06-17days on market $184,999 Active 64 DOM
-
2026-06-16days on market $184,999 Active 63 DOM
-
2026-06-15days on market $184,999 Active 62 DOM
-
2026-06-13days on market $184,999 Active 60 DOM
-
2026-06-13days on market $184,999 Active 59 DOM
-
2026-06-09days on market $184,999 Active 56 DOM
-
2026-06-08days on market $184,999 Active 55 DOM
-
2026-06-07days on market $184,999 Active 54 DOM
-
2026-06-04days on market $184,999 Active 51 DOM
-
2026-06-03days on market $184,999 Active 50 DOM
-
2026-06-02days on market $184,999 Active 49 DOM
-
2026-06-01days on market $184,999 Active 48 DOM
-
2026-05-31days on market $184,999 Active 47 DOM
-
2026-05-22price $184,999
-
2026-04-12$204,500 Active
ⓘ Source: listings_history table (triggers on properties + properties_extension) + one-shot
backfill from property_details.listing_events for pre-trigger history.
Climate risk First Street
- Flood 1/10 Low FEMA zone X (unshaded) · 0% chance over 30 yrs
- Wildfire 1/10 Low
- Heat 4/10 Moderate 7 d/yr ≥84°F today · 18 d/yr by 30 yrs out
- Wind 1/10 Low
- Air quality 3/10 Moderate 4 unhealthy d/yr today · 4 by 30 yrs out
Nearby sold comps map
Loading sold comps map…
Walkable amenities ~0.75 mi
Loading nearby amenities…
Taxation est. · year 1
- Rental income
- $36,002
- − Mortgage interest
- −$10,363
- − Property taxes
- −$2,775
- − Insurance
- −$925
- − Repairs & maintenance
- −$2,880
- − Management
- −$2,880
- − Depreciation
- −$5,382
- Taxable income
- $10,797
- Est. tax owed @ 24.0%
- −$2,591
- After-tax cash flow
- $10,509/yr
For passive investors: Depreciation is non-cash, so a rental often shows a tax loss while cash-flowing — sheltering income. Rental losses are passive: they offset passive income freely, and up to $25,000/yr can offset ordinary (W-2) income if you actively participate and your MAGI is under $100k (phasing out to $0 by $150k); unused losses carry forward. On sale, claimed depreciation is recaptured at up to 25%, and gains may owe capital-gains tax (a 1031 exchange can defer both). Figures are a year-1 estimate at your 24.0% rate — not tax advice; consult a CPA.
Schools (NCES district)
- District
- San Dieguito Union High
- NCES district ID
- 0634380
- Math proficiency
- 72% ▬ 0.00%
- Reading proficiency
- 79% ▼ -1.00%
- Median HH income
- $110,199
- Composite
- 70.63/100
- National rank
- #519
- State rank
- #56 of 1400 in CA
Livability — Encinitas
- Score
- 79/100
- State rank
- #54
- US rank
- #2026
Category grades
Schools grade is shown separately in the Schools card above.
Census & demographics
- Census place
- Encinitas, CA
- County
- San Diego County · 3,178,799 people
- City population
- 61,717
- Metro
- San Diego-Chula Vista-Carlsbad, CA
- Population (ZIP)
- 50,617
- Household income
- $158,507
- Rent vs Own
- Severe rent burden
- 1537.0
Population outlook (San Diego County) Hauer SSP2
- Today (2025)
- 3,678,185 people
- By 2030
- 3,856,546 · +4.8%
- By 2040
- 4,171,407 · +13.4%
- By 2050
- 4,421,607 · +20.2%
- By 2075
- 4,831,599 · +31.4%
- By 2100
- 4,832,502 · +31.4%
Race, ethnicity, and origin ACS 2023
- Neighborhood character
- Predominantly White (75%)
- Race & ethnicity
- White 75% Hispanic / Latino 14% Two or more races 11% Asian 5%
- Hispanic origin (detail)
- Mexican 10%
- Common ancestry
- Italian 4% Romanian 3% Slovak 3%
- Foreign-born
- 12% · Canada, China
- Languages at home
- 84% English-only · Spanish 9% Other Indo-European 2% German/W. Germanic 1%
Political lean MEDSL · San Diego
- 2024 margin
- D (+16.8) · D 56.9% · R 40.1% · Other 2.9%
- 2008→2024 swing
- +6.6pp toward D · 2008: 10.2pp · 2024: 16.8pp
- All cycles
- 2024: D+16.8 2020: D+22.8 2016: D+17.8 2012: D+5.1 2008: D+10.2
Not yet ingested
- Civics
- —
Market trends
- HPI YoY
- ▼ -881.14%
- Current HPI
- 461.5044
- Rent YoY
- ▲ 5.39%
- Metro
- San Diego-Chula Vista-Carlsbad, CA
- State GDP YoY
- ▲ 3.21%
- F500 in state
- 116
Industry mix (Fortune 500 HQ in CA)
| Industry | F500 HQs | Revenue |
|---|---|---|
| Technology | 27 | $1,492B |
|
||
| Financial Services | 3 | $174B |
|
||
| Retail | 3 | $44B |
|
||
| Insurance | 3 | $26B |
|
||
| Media / Entertainment | 2 | $115B |
|
||
| Pharmaceuticals / Biotech | 2 | $62B |
|
||
Price history
-9.5% since first listed2 events — show timeline
- 2026-05-22 Price Changed $184,999 CRMLS
- 2026-04-12 Listed $204,500 CRMLS
Property tax history
-7.2%/yrLatest (2013): $295 · +0.9% YoY. Source: county tax records.
Cash-flow waterfall
monthlySold comps — $/sqft
last 12 mo · ≤1 miLoading sold comps…