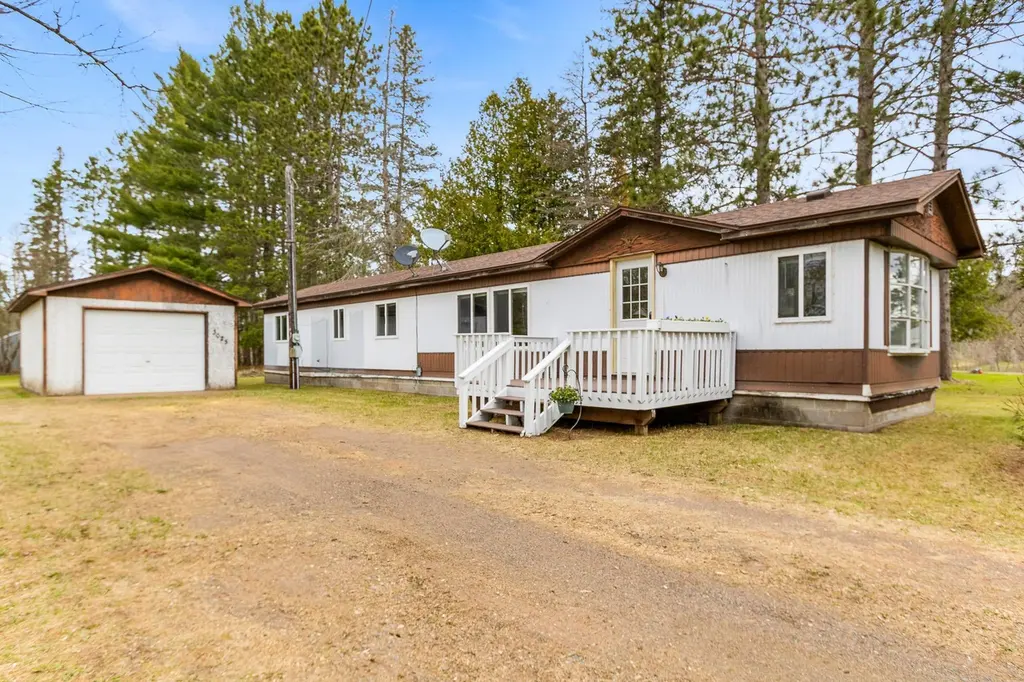
3025 Doe St · Willow River, MN
Flood risk 1/10 · Minimal
- FEMA flood zone
- X (unshaded)
- Chance of flooding over 30 yrs
- 0.0%
- Est. flood insurance / yr
- $473 – $860
Fire risk 4/10 · Minor
- Est. fire insurance / yr
- $888 – $1,650
Heat risk 1/10 · Minimal
- Hot days now (above 94°F)
- 7 days/yr
- Hot days in 30 yrs
- 13 days/yr
Wind risk 1/10 · Minimal
- Chance of severe wind over 30 yrs
- —
Air-quality risk 1/10 · Minimal
- Unhealthy air days now
- 0 days/yr
- Unhealthy air days in 30 yrs
- 0 days/yr
Risk factors via First Street. Map © Google.
Why this score? — see what drove the D grade
The composite is a weighted blend of 9 inputs, each scored 0–100. Each bar is that input's sub-score; the figure is the points it added to the 100-point composite (weight × sub-score).
- Cash flow +10.6/30.0
- Appreciation +10.0/10.0
- ARV discount +7.5/15.0
- DSCR +3.1/10.0
- Schools +2.9/10.0
- Livability +2.9/5.0
- Rent growth +2.5/5.0
- Condition / age +2.5/5.0
- 1% rule +1.9/10.0
$130,000
🖨 Deal sheet 📄 Offer letter ✓ Due diligence
Listing remarks
Charming 2-bedroom, 1-bath home located in the heart of Willow River. This property features several recent updates, including new flooring, fresh paint, added insulation, and a newer furnace. The home offers a detached garage and a spacious backyard! Conveniently located near state land and within walking distance to Willow River Area School District #577.
Key facts
- Recent updates
- Fresh paint
- Newer furnace
Tags
Property features AI
Finance
- Financial info: Other annual assessment: $168.42; Annual tax amount: $485.58 (tax year 2026); Tax with assessments: $654
Exterior
- Parking: Gravel parking; Detached garage (1-car, approx. 14x20)
- Utilities: City water (connected) with sand point; City sewer (connected); Natural gas; Electric service by Minnesota Power
- Home design: Manufactured home; One story
- Construction: Approximately 8 years old roof; 720 sq ft above-grade living area; 720 sq ft foundation area
- Exterior features: Deck; Light tree coverage; City street frontage with paved roads; Publicly maintained road
Interior
- Kitchen: Range; Refrigerator
- Bedrooms: Two bedrooms (both on the main level)
- Bathrooms: One full bathroom (main floor)
- Heating & cooling: Forced air heating; Wall-mounted cooling unit(s)
- Interior features: All living facilities on one level; Kitchen and dining combined
- Laundry & utility: Hall laundry
Neighborhood map
What this means for you Summary
Snapshot
- This is a 3-bed/2.0-bath manufactured listed at $130k.
Deal economics
- At list price, monthly cash flow is $-63 ($-760/yr) — negative.
- To cash-flow at today's rent, offer at most $119k (8.6% below list).
- To meet the 1% rule (rent ≥ 1% of price), the offer needs to be $90k (30.9% below list).
- Recommended offer: $90k (30.9% below list) — sets the bar for 1% rule.
Location & tenants
- Location reads 58/100 on livability (#806 in MN) — a working-class tenant base; expect higher turnover. Strengths: cost of living A+, housing A+; Watch: crime C-, schools D+, health & safety D.
- Willow River Public School District (rural): math 24% / reading 45% proficiency, ranked #261 of 301 in MN (top 87%) — families likely to look elsewhere, expect single-tenant / working-renter base with shorter leases.
- Market conditions: 23 active listings in the ZIP; 116 units permitted in Pine County in 2024 (0 in 5+ unit buildings).
Forward outlook
- In year one you build about $14k of equity ($899 loan paydown + $13k appreciation (10.0% local appreciation)).
- Pine County population projected at -24% by 2050 — secular population decline; favor cash flow + early exit over multi-decade hold.
- At projected returns (10.0% appreciation + 3.0% rent growth), your $36k cash investment doubles in ~3 years — after that, you're playing with house money.
- By year 3, paydown + projected appreciation supports a ~$35k cash-out refi (75% LTV) — recoverable capital for the next deal without selling this one.
Negotiation context
- Only 13 days on market — expect competitive offers; lowballing is unlikely to land.
- 3 sale attempts since 9y ago with the ask held roughly flat each time — persistent listings suggest the price (not the market) is what's stuck; bring a comps-based counter.
- Current owner paid $109k; 19% above their basis — modest negotiation headroom, anchor on the comps not their cost.
Questions for the listing agent
- What do current leases actually rent for vs. the listed asking? Can we see a recent rent roll and the last 12 months of T-12 income?
- Built in 1978 — when were the roof, HVAC, electrical panel, plumbing, and water heater last replaced?
- Is there a deadline driving the sale (1031 exchange, divorce, estate, relocation)? That informs how much negotiation room exists.
- Schools are D-rated, which usually means shorter tenancies and higher turnover. Who's the typical renter profile here, and what's been the actual vacancy rate?
- The area grade is low — what's the realistic commute time and amenity access for the typical tenant pool here? Any planned neighborhood developments (good or bad) we should know about?
- What's the average days-on-market for RENTAL listings here right now (not sales)? A rising rental-DOM trend means longer vacancies and softer asking-rent achievability than the comps imply.
- What's the recent tenant-quality profile in this submarket — average credit score on applications, eviction rate, late-payment / NSF rate, and stable-employment percentage? A property-management company in the area should have these aggregated.
- How much new for-sale + rental construction is in the pipeline within 1–3 miles? Heavy new supply typically softens prices + rents 12–24 months out; constrained supply supports both.
Investment metrics
- 1% rule
- 0.69% ✗
- Cap rate
- 5.71%
- Cash-on-cash
- -2.09%
- DSCR
- 0.91
- GRM
- 12.1
CMA / ARV
No comps found within radius.
Projected returns pro-forma
10.0% appreciation · 3.0% rent growth · sell at horizon
- IRR
- 22.8%
- Equity multiple
- 2.83×
- Total profit
- $66,703
- Equity at exit
- $117,114
- IRR
- 20.3%
- Equity multiple
- 6.48×
- Total profit
- $199,477
- Equity at exit
- $252,561
Cash invested: $36,400 (down + closing). Projections, not guarantees.
Landlord ↔ Tenant lean methodology
- Overall (STATE)
- 46 Balanced
- State Minnesota
- 46 Balanced · D+2
- County
- — inherits STATE
- City
- — inherits STATE
ZIP-level market 55795
- Home prices YoY
- 11.1%
- Active inventory
- 23
- Price-to-rent
- 12.1×
Monthly cashflow live
- Estimated rent
- $898 medium interval (Pro) →
- Mortgage (P&I)
- −$682
- Tax from tax record
- −$37 /mo · $443/yr
- Insurance
- −$54
- HOA
- −$0
- Vacancy / Maint / Mgmt
- −$189
- Net cashflow
- $-63
Break-even live
UW: 25.0% down · 7.5% · 30yr · 1.5% tax · 5.0% vac · 8.0% maint · 8.0% mgmt
Financing live
Cash to close
- Down payment
- $32,500
- Closing costs
- $3,900
- Reserves months
- —
- Total cash needed
- —
Loan-product check · same deal, 3 products live
Conventional
25% down · 7.5% · 30yr
- Down + closing
- —
- Monthly P&I
- —
- Monthly cashflow
- —
- DSCR
- —
- Eligible?
- —
Personal DTI + credit; lowest rate.
DSCR
20% down · 8.5% · 30yr
- Down + closing
- —
- Monthly P&I
- —
- Monthly cashflow
- —
- DSCR
- —
- Eligible?
- —
No personal income docs; deal must DSCR.
Hard money
10% down · 12.0% · 12mo
- Down + closing
- —
- Monthly P&I
- —
- Monthly cashflow
- —
- DSCR
- —
- Eligible?
- —
Short-term bridge; refi at stabilization.
Listing history 12 events
-
2026-05-14status Pending 359-char remark
-
2026-05-01$130,000 Active 359-char remark
-
2019-07-15soldstatus $41,125
-
2018-11-13historical
-
2018-09-28$49,900 Active
-
2018-05-07historical
-
2017-11-22$50,000 Active
-
2008-03-22soldstatus $50,000
-
2005-06-28soldstatus $34,000
-
2000-03-31soldstatus $28,500
-
1998-12-16soldstatus $28,500
-
1995-01-02soldstatus $23,500
ⓘ Source: listings_history table (triggers on properties + properties_extension) + one-shot
backfill from property_details.listing_events for pre-trigger history.
Tax reassessment forecast MN · Partial reset (capped growth)
- Current annual tax
- $443 · $37/mo
- Projected year-2 tax
- $950 · $79/mo
- Expected delta
- +$506/yr (+$42/mo · 114.3%)
ⓘ Screening estimate from a state-policy table — verify with the county assessor before closing.
Climate risk First Street
- Flood 1/10 Low FEMA zone X (unshaded) · 0% chance over 30 yrs
- Wildfire 4/10 Moderate
- Heat 1/10 Low 7 d/yr ≥94°F today · 13 d/yr by 30 yrs out
- Wind 1/10 Low
- Air quality 1/10 Low 0 unhealthy d/yr today · 0 by 30 yrs out
Nearby sold comps map
Loading sold comps map…
Walkable amenities ~0.75 mi
Loading nearby amenities…
Taxation est. · year 1
- Rental income
- $10,777
- − Mortgage interest
- −$7,282
- − Property taxes
- −$443
- − Insurance
- −$650
- − Repairs & maintenance
- −$862
- − Management
- −$862
- − Depreciation
- −$3,782
- Taxable loss
- −$3,104
- Est. tax savings @ 24.0%
- +$745
- After-tax cash flow
- $-15/yr
For passive investors: Depreciation is non-cash, so a rental often shows a tax loss while cash-flowing — sheltering income. Rental losses are passive: they offset passive income freely, and up to $25,000/yr can offset ordinary (W-2) income if you actively participate and your MAGI is under $100k (phasing out to $0 by $150k); unused losses carry forward. On sale, claimed depreciation is recaptured at up to 25%, and gains may owe capital-gains tax (a 1031 exchange can defer both). Figures are a year-1 estimate at your 24.0% rate — not tax advice; consult a CPA.
Schools (NCES district)
- District
- Willow River Public School District
- NCES district ID
- 2742750
- Math proficiency
- 24% ▼ -22.00%
- Reading proficiency
- 45% ▼ -13.00%
- Median HH income
- $42,510
- Composite
- 29.14/100
- National rank
- #6584
- State rank
- #261 of 301 in MN
Livability — Willow River
- Score
- 58/100
- State rank
- #806
- US rank
- #20791
Category grades
Schools grade is shown separately in the Schools card above.
Census & demographics
- Census place
- Willow River, MN
- Population (ZIP)
- 1,876
Population outlook (Pine County) Hauer SSP2
- Today (2025)
- 27,565 people
- By 2030
- 26,567 · -3.6%
- By 2040
- 23,878 · -13.4%
- By 2050
- 20,931 · -24.1%
- By 2075
- 15,372 · -44.2%
- By 2100
- 11,032 · -60.0%
Race, ethnicity, and origin ACS 2023
- Neighborhood character
- Predominantly White (91%)
- Race & ethnicity
- White 91% Two or more races 4% Black 4%
- Common ancestry
- Romanian 16% Portuguese 9% Italian 6%
- Foreign-born
- 1%
- Languages at home
- 98% English-only · Spanish 1%
Political lean MEDSL · Pine
- 2024 margin
- Solid R (+35.2) · D 31.6% · R 66.8% · Other 1.6%
- 2008→2024 swing
- -36.7pp toward R · 2008: 1.5pp · 2024: -35.2pp
- All cycles
- 2024: R+35.2 2020: R+30.2 2016: R+26.3 2012: R+0.7 2008: D+1.5
Not yet ingested
- Civics
- —
Market trends
- HPI YoY
- ▲ 23.82%
- Current HPI
- 237.7192
- Rent YoY
- —
- Metro
- —
- State GDP YoY
- ▲ 2.41%
- F500 in state
- 34
Industry mix (Fortune 500 HQ in MN)
| Industry | F500 HQs | Revenue |
|---|---|---|
| Healthcare | 2 | $407B |
|
||
| Retail | 2 | $150B |
|
||
| Consumer Goods | 2 | $32B |
|
||
| Industrial Machinery | 2 | $6B |
|
||
| Agriculture | 1 | $40B |
|
||
| Healthcare / Medical Devices | 1 | $32B |
|
||
Price history
+363.8% since first listed14 events — show timeline
- 2026-05-29 Sold (Public Records) $109,000 Public Records
- 2026-05-29 Sold (MLS) $109,000 NORTHSTARMLS as Distributed by MLS Grid
- 2026-05-14 Pending — NORTHSTARMLS as Distributed by MLS Grid
- 2026-05-01 Listed $130,000 NORTHSTARMLS as Distributed by MLS Grid
- 2019-07-15 Sold (Public Records) $41,125 Public Records
- 2018-11-13 Listing Removed — NORTHSTARMLS as Distributed by MLS Grid
- 2018-09-28 Listed $49,900 NORTHSTARMLS as Distributed by MLS Grid
- 2018-05-07 Listing Removed — NORTHSTARMLS as Distributed by MLS Grid
- 2017-11-22 Listed $50,000 NORTHSTARMLS as Distributed by MLS Grid
- 2008-03-22 Sold (Public Records) $50,000 Public Records
- 2005-06-28 Sold (Public Records) $34,000 Public Records
- 2000-03-31 Sold (Public Records) $28,500 Public Records
- 1998-12-16 Sold (Public Records) $28,500 Public Records
- 1995-01-02 Sold (Public Records) $23,500 Public Records
Property tax history
-2.8%/yrLatest (2025): $443 · +8.4% YoY. Source: county tax records.
Cash-flow waterfall
monthlySold comps — $/sqft
last 12 mo · ≤1 miLoading sold comps…