446 Clear Rain St · Lavon, TX
Flood risk No data
- FEMA flood zone
- —
- Chance of flooding over 30 yrs
- —
- Est. flood insurance / yr
- —
Fire risk No data
- Est. fire insurance / yr
- —
Heat risk No data
- Hot days now (above threshold)
- —
- Hot days in 30 yrs
- —
Wind risk No data
- Chance of severe wind over 30 yrs
- —
Air-quality risk No data
- Unhealthy air days now
- —
- Unhealthy air days in 30 yrs
- —
Risk factors via First Street. Map © Google.
Why this score? — see what drove the D grade
The composite is a weighted blend of 9 inputs, each scored 0–100. Each bar is that input's sub-score; the figure is the points it added to the 100-point composite (weight × sub-score).
- ARV discount +14.1/15.0
- Cash flow +8.0/30.0
- Condition / age +4.0/5.0
- Livability +3.3/5.0
- 1% rule +3.2/10.0
- Schools +3.2/10.0
- Rent growth +2.5/5.0
- DSCR +2.0/10.0
- Appreciation +0.0/10.0
$267,990
🖨 Deal sheet 📄 Offer letter ✓ Due diligence
Listing remarks
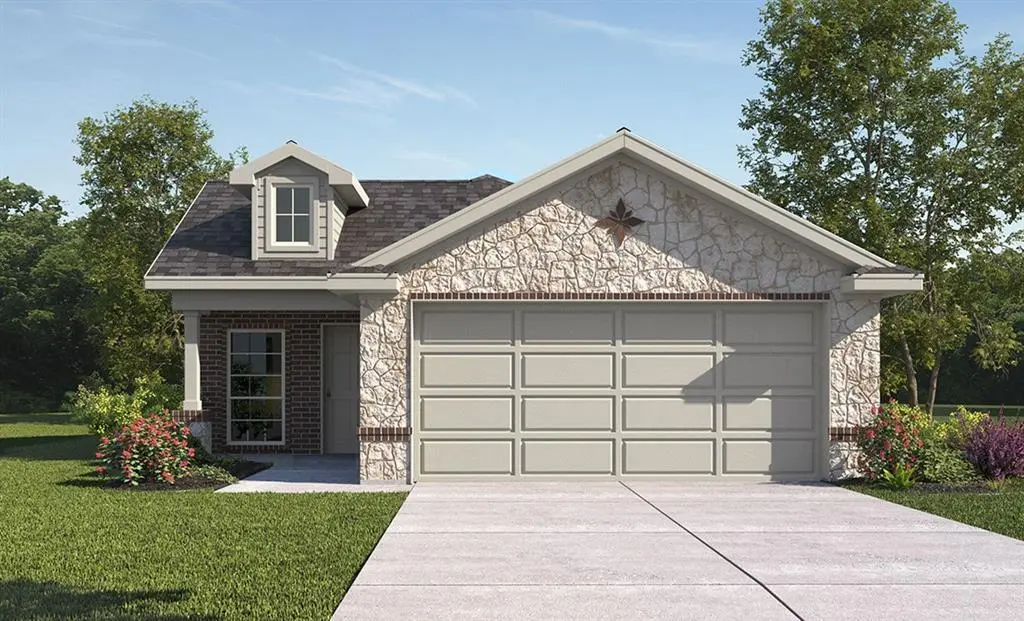
New! Super cute single story, three bedrooms, two full baths! Home includes, eat-in kitchen, grannite counters throughout, LED lighting, full sprinkler system, professionally engineered post tension foundation, and so much more! Perfectly situated on FM 6, just half a mile from Highway 78, Elevon provides easy access to Farmersville, Rockwall, and neighboring towns. Enjoy the proximity to Lake Lavon, just 1-mile away, where you can indulge in camping, picnicking, and various outdoor activities. Don't miss out on the opportunity to make Elevon your new home. Contact us today to schedule a tour and discover the endless possibilities that await you.
Key facts
- 4,792 sq ft lot
- 2 garage spots
- Built 2026
Property features AI
Finance
- Other: Energy-efficient features including enhanced attic insulation, insulated windows, efficient HVAC, efficient lighting, thermostat, and efficient construction/insulation
- Financial info: Acceptable financing: Cash, Conventional, FHA, USDA, VA
- HOA & community: Mandatory association with full use of facilities; HOA fee $155 monthly
Exterior
- Parking: Attached 2-car garage; Covered parking for 2 vehicles (2-car single door)
- Security: Carbon monoxide detector(s); Smoke detector(s)
- Utilities: City water; City sewer; Located in a municipal utility district
- Home design: Single family residence; One story; Residential property; Not attached to another unit; Subdivision: Elevon
- Construction: Brick construction; Composition roof; Slab foundation; New construction (incomplete) — 2026
- Exterior features: Wood fencing
Interior
- Kitchen: Granite counters; Built-in cabinets; Eat-in kitchen; Pantry; Water line to refrigerator; Microwave; Electric range; Dishwasher; Disposal
- Bedrooms: Primary bedroom (Level 1) with ensuite bath and walk-in closet; Bedroom (Level 1) — split bedroom layout; Bedroom (Level 1) — split bedroom layout
- Flooring: Carpet; Laminate
- Bathrooms: 2 full bathrooms
- Heating & cooling: Central heating (electric); Central air conditioning (electric)
- Interior features: Open floorplan; Decorative lighting; Eat-in kitchen; Granite counters; Pantry; Cable TV available; High speed internet available
Neighborhood map
What this means for you Summary
Snapshot
- This is a 3-bed/2.0-bath single-family listed at $268k. Condition is rated good.
Deal economics
- At list price, monthly cash flow is $-278 ($-3k/yr) — negative.
- To cash-flow at today's rent, offer at most $228k (15.0% below list).
- To meet the 1% rule (rent ≥ 1% of price), the offer needs to be $219k (18.3% below list).
- Recommended offer: $219k (18.3% below list) — sets the bar for 1% rule.
Location & tenants
- Location reads 66/100 on livability (#588 in TX) — a middle-class / working-renter tenant base. Strengths: employment A+, housing A+, cost of living B; Watch: amenities F, commute F, health & safety F.
- Community ISD (rural): math 30% / reading 38% proficiency, ranked #479 of 826 in TX (top 58%) — families likely to look elsewhere, expect single-tenant / working-renter base with shorter leases.
- Zoned schools: Nesmith El (math 46% / reading 46%, grade D-, #1,097 of 4,322 statewide, top 26%, 768 students, 44% FRL).
- Zoned-school proficiency averages 46% at this address vs 34% district-wide (+12 pts) — the actual schools serving this property are materially stronger than the Community ISD average implies; a family-tenant draw the district grade alone would hide.
- Market conditions: 634 active listings in the ZIP; 37 comparable units currently listed for rent nearby; rentals at typical pace (median 24d on market — plan ~3-4 weeks tenant-placement turnaround); high-income renter base; 19,194 units permitted in Collin County in 2024 (3,988 in 5+ unit buildings).
Forward outlook
- Local home prices are declining (-3.0%/yr); year-one equity from $2k of loan paydown is wiped out by about $8k of value loss. Plan a longer hold.
- Collin County population projected at +60% by 2050 — long-run rental-demand tailwind backs the buy-and-hold thesis.
Negotiation context
- It's been on market 49 days — a 3% lower offer ($260k) is reasonable based on typical stale-listing flexibility.
Questions for the listing agent
- What do current leases actually rent for vs. the listed asking? Can we see a recent rent roll and the last 12 months of T-12 income?
- It's been on market 49 days. Have you received any prior offers? Is the seller open to a 18% concession, seller financing, or rate buy-down credit?
- What does the HOA fee cover, when was the last increase, and are there any pending special assessments or reserve-fund shortfalls?
- Is there a deadline driving the sale (1031 exchange, divorce, estate, relocation)? That informs how much negotiation room exists.
- The area grade is low — what's the realistic commute time and amenity access for the typical tenant pool here? Any planned neighborhood developments (good or bad) we should know about?
- What's the average days-on-market for RENTAL listings here right now (not sales)? A rising rental-DOM trend means longer vacancies and softer asking-rent achievability than the comps imply.
- What's the recent tenant-quality profile in this submarket — average credit score on applications, eviction rate, late-payment / NSF rate, and stable-employment percentage? A property-management company in the area should have these aggregated.
- How much new for-sale + rental construction is in the pipeline within 1–3 miles? Heavy new supply typically softens prices + rents 12–24 months out; constrained supply supports both.
Investment metrics
- 1% rule
- 0.82% ✗
- Cap rate
- 5.05%
- Cash-on-cash
- -4.45%
- DSCR
- 0.80
- GRM
- 10.2
CMA / ARV
- ARV (median comp)
- $314,240
- List price
- $267,990
- Delta
- -14.72%
- Verdict
- UNDERPRICED
- Comps
- 20 within 1.0 mi
Show comp detail 12 sales within ~0.75 mi
| Address | Dist | Beds/Ba | Sqft | Sold | Price | $/sf | Match |
|---|---|---|---|---|---|---|---|
| 521 Epiphany Ln | 0.06mi | 3/2.0 | 1,429 (+2%) | 2mo | $259,990 | $182 | 93 |
| 549 Epiphany Ln | 0.17mi | 3/2.0 | 1,429 (+2%) | 2mo | $268,990 | $188 | 88 |
| 653 Glee Stem Rd | 0.17mi | 3/2.0 | 1,537 (+9%) | 2mo | $314,990 | $205 | 75 |
| 822 Sunflower | 0.49mi | 3/2.0 | 1,472 (+5%) | 0mo | $269,854 | $183 | 69 |
| 529 Epiphany Ln | 0.17mi | 3/2.0 | 1,604 (+14%) | 2mo | $319,990 | $199 | 67 |
| 1230 Bellflower Rd | 0.53mi | 3/2.0 | 1,335 (-5%) | 1mo | $272,990 | $204 | 66 |
| 868 Sunflower Rd | 0.49mi | 3/2.0 | 1,504 (+7%) | 1mo | $282,990 | $188 | 64 |
| 881 River Ln | 0.51mi | 3/2.0 | 1,503 (+7%) | 0mo | $282,990 | $188 | 64 |
| 850 Sunflower Rd | 0.49mi | 3/2.0 | 1,503 (+7%) | 2mo | $279,990 | $186 | 64 |
| 858 River Ln | 0.54mi | 3/2.0 | 1,504 (+7%) | 1mo | $282,990 | $188 | 62 |
| 872 Sunflower Rd | 0.49mi | 3/2.0 | 1,237 (-12%) | 1mo | $267,990 | $217 | 56 |
| 965 Dahlia Dr | 0.53mi | 3/2.0 | 1,232 (-12%) | 2mo | $259,990 | $211 | 53 |
Match score weights: distance 35% · size 25% · config 20% · recency 20%. Top-matched comps best support the ARV.
Projected returns pro-forma
-3.0% appreciation · 3.0% rent growth · sell at horizon
- IRR
- -23.8%
- Equity multiple
- 0.19×
- Total profit
- $-61,012
- Equity at exit
- $39,958
- IRR
- -18.6%
- Equity multiple
- -0.01×
- Total profit
- $-75,416
- Equity at exit
- $23,171
Cash invested: $75,037 (down + closing). Projections, not guarantees.
Landlord ↔ Tenant lean methodology
- Overall (STATE)
- 87 Strongly Landlord-Friendly
- State Texas
- 87 Strongly Landlord-Friendly · R+5
- County
- — inherits STATE
- City
- — inherits STATE
ZIP-level market 75166
- Home prices YoY
- -9.9%
- Active inventory
- 634
- Price-to-rent
- 10.2×
Monthly cashflow live
- Estimated rent
- $2,188 high interval (Pro) →
- Mortgage (P&I)
- −$1,405
- Tax est. 1.5%
- −$335 /mo · $4,020/yr
- Insurance
- −$112
- HOA
- −$155
- Vacancy / Maint / Mgmt
- −$460
- Net cashflow
- $-278
Break-even live
UW: 25.0% down · 7.5% · 30yr · 1.5% tax · 5.0% vac · 8.0% maint · 8.0% mgmt
Financing live
Cash to close
- Down payment
- $66,998
- Closing costs
- $8,040
- Reserves months
- —
- Total cash needed
- —
Loan-product check · same deal, 3 products live
Conventional
25% down · 7.5% · 30yr
- Down + closing
- —
- Monthly P&I
- —
- Monthly cashflow
- —
- DSCR
- —
- Eligible?
- —
Personal DTI + credit; lowest rate.
DSCR
20% down · 8.5% · 30yr
- Down + closing
- —
- Monthly P&I
- —
- Monthly cashflow
- —
- DSCR
- —
- Eligible?
- —
No personal income docs; deal must DSCR.
Hard money
10% down · 12.0% · 12mo
- Down + closing
- —
- Monthly P&I
- —
- Monthly cashflow
- —
- DSCR
- —
- Eligible?
- —
Short-term bridge; refi at stabilization.
Rent comps 37 comps
| Address | Beds | Baths | Sqft | Rent | $/sqft | DOM | Units | Dist |
|---|---|---|---|---|---|---|---|---|
| 759 Crestridge Dr Lavon, TX | 3.0 | 2.0 | 1827 | $2,000 | $1.09 | 12d | 1 | 0.18mi |
| 744 Devonshire Dr Lavon, TX | 3.0 | 2.0 | 1589 | $1,849 | $1.16 | 6d | 1 | 0.23mi |
| 684 Crestridge Dr Lavon, TX | 3.0 | 2.0 | 1634 | $1,850 | $1.13 | 43d | 1 | 0.23mi |
| 755 Revere Ln Lavon, TX | 3.0 | 2.0 | 1829 | $2,100 | $1.15 | 24d | 1 | 0.25mi |
| 787 Wellington Dr Lavon, TX | 3.0 | 2.0 | 1429 | $1,900 | $1.33 | 43d | 1 | 0.27mi |
| 600 Crestridge Dr Lavon, TX | 4.0 | 2.0 | 1827 | $2,300 | $1.26 | 43d | 1 | 0.28mi |
| 772 Wellington Dr Lavon, TX | 3.0 | 2.0 | 1459 | $1,850 | $1.27 | 43d | 1 | 0.29mi |
| 575 London Dr Lavon, TX | 3.0 | 2.0 | 1589 | $1,950 | $1.23 | 15d | 1 | 0.31mi |
| 557 London Dr Unit 557LD Lavon, TX | 3.0 | 2.0 | 1769 | $2,000 | $1.13 | 7d | 1 | 0.33mi |
| 760 Richmond Dr Lavon, TX | 4.0 | 2.0 | 1779 | $3,000 | $1.69 | 43d | 1 | 0.34mi |
| 536 London Dr Lavon, TX | 3.0 | 2.0 | 1589 | $1,950 | $1.23 | 15d | 1 | 0.37mi |
| 766 Camden Dr Lavon, TX | 3.0 | 2.0 | 1802 | $6,200 | $3.44 | 2d | 1 | 0.39mi |
| 509 London Dr Lavon, TX | 3.0 | 2.0 | 1769 | $2,000 | $1.13 | 43d | 1 | 0.39mi |
| 778 Camden Dr Lavon, TX | 3.0 | 2.0 | 1636 | $1,750 | $1.07 | 12d | 1 | 0.39mi |
| 946 Olive Dr Lavon, TX | 3.0 | 2.0 | 1628 | $2,650 | $1.63 | 7d | 1 | 0.47mi |
| 872 Sunflower Rd Lavon, TX | 3.0 | 2.0 | 1237 | $2,000 | $1.62 | 7d | 1 | 0.51mi |
| 858 River Ln Lavon, TX | 3.0 | 2.0 | 1504 | $2,200 | $1.46 | 16d | 1 | 0.56mi |
| 382 Armstrong Ln Lavon, TX | 3.0 | 2.5 | 1308 | $1,795 | $1.37 | 20d | 1 | 0.56mi |
| 393 Orbit Dr Lavon, TX | 3.0 | 2.0 | 1268 | $1,750 | $1.38 | 18d | 1 | 0.57mi |
| 366 Armstrong Ln Lavon, TX | 3.0 | 2.0 | 1268 | $1,750 | $1.38 | 24d | 1 | 0.57mi |
| 387 Orbit Dr Lavon, TX | 3.0 | 2.5 | 1361 | $1,775 | $1.30 | 16d | 1 | 0.58mi |
| 355 Armstrong Ln Lavon, TX | 3.0 | 2.0 | 1268 | $1,695 | $1.34 | 24d | 1 | 0.61mi |
| 365 Orbit Dr Lavon, TX | 3.0 | 2.5 | 1361 | $1,795 | $1.32 | 2d | 1 | 0.61mi |
| 366 Schirra Ct Lavon, TX | 3.0 | 2.0 | 1165 | $1,650 | $1.42 | 43d | 1 | 0.62mi |
| 345 Orbit Dr Lavon, TX | 3.0 | 2.0 | 1268 | $1,685 | $1.33 | 43d | 1 | 0.65mi |
| 332 Schirra Ct Lavon, TX | 3.0 | 2.0 | 1202 | $1,695 | $1.41 | 20d | 1 | 0.65mi |
| 332 Schirra Ct Lavon, TX | 3.0 | 2.0 | 1202 | $1,695 | $1.41 | 24d | 1 | 0.65mi |
| 341 Orbit Dr Lavon, TX | 3.0 | 2.5 | 1361 | $1,795 | $1.32 | 43d | 1 | 0.66mi |
| 339 Orbit Dr Lavon, TX | 3.0 | 2.5 | 1361 | $1,795 | $1.32 | 43d | 1 | 0.66mi |
| 315 Orbit Dr Lavon, TX | 3.0 | 2.0 | 1268 | $1,750 | $1.38 | 43d | 1 | 0.71mi |
| 305 Orbit Dr Lavon, TX | 3.0 | 2.0 | 1268 | $1,695 | $1.34 | 43d | 1 | 0.73mi |
| 471 Harding Ln Lavon, TX | 4.0 | 2.0 | 1645 | $1,950 | $1.19 | 43d | 1 | 0.90mi |
| 476 Eisenhower Ln Lavon, TX | 3.0 | 2.0 | 1544 | $1,875 | $1.21 | 20d | 1 | 0.95mi |
| 436 Grant Ln Lavon, TX | 3.0 | 2.0 | 1755 | $2,299 | $1.31 | 3d | 1 | 0.98mi |
| 590 Arthur Dr Lavon, TX | 3.0 | 2.0 | 1556 | $1,850 | $1.19 | 43d | 1 | 0.99mi |
| 579 White Water Dr Lavon, TX | 3.0 | 2.0 | 1838 | $2,000 | $1.09 | 24d | 1 | 1.27mi |
| 200 Villas Dr Lavon, TX | 1.0–2.0 | 1.0–2.0 | 873 | $1,918 | $2.20 | 1d | 5 | 1.48mi |
HOA detail
- Monthly dues
- $155 · $1,860/yr
Listing history 17 events
-
2026-06-18days on market $267,990 Active 49 DOM
-
2026-06-17pricedays on market $267,990 Active 48 DOM
-
2026-06-16days on market $277,990 Active 47 DOM
-
2026-06-15days on market $277,990 Active 46 DOM
-
2026-06-13days on market $277,990 Active 44 DOM
-
2026-06-13days on market $277,990 Active 43 DOM
-
2026-06-09days on market $277,990 Active 40 DOM
-
2026-06-08days on market $277,990 Active 39 DOM
-
2026-06-07days on market $277,990 Active 38 DOM
-
2026-06-04days on market $277,990 Active 35 DOM
-
2026-06-03days on market $277,990 Active 34 DOM
-
2026-06-02days on market $277,990 Active 33 DOM
-
2026-06-01days on market $277,990 Active 32 DOM
-
2026-05-31days on market $277,990 Active 31 DOM
-
2026-05-13price $277,990 655-char remark
-
2026-05-11price $307,990 655-char remark
-
2026-04-30$306,990 Active 655-char remark
ⓘ Source: listings_history table (triggers on properties + properties_extension) + one-shot
backfill from property_details.listing_events for pre-trigger history.
Nearby sold comps map
Loading sold comps map…
Walkable amenities ~0.75 mi
Loading nearby amenities…
Taxation est. · year 1
- Rental income
- $26,262
- − Mortgage interest
- −$15,012
- − Property taxes
- −$4,020
- − Insurance
- −$1,340
- − Repairs & maintenance
- −$2,101
- − Management
- −$2,101
- − HOA
- −$1,860
- − Depreciation
- −$7,796
- Taxable loss
- −$7,968
- Est. tax savings @ 24.0%
- +$1,912
- After-tax cash flow
- $-1,425/yr
For passive investors: Depreciation is non-cash, so a rental often shows a tax loss while cash-flowing — sheltering income. Rental losses are passive: they offset passive income freely, and up to $25,000/yr can offset ordinary (W-2) income if you actively participate and your MAGI is under $100k (phasing out to $0 by $150k); unused losses carry forward. On sale, claimed depreciation is recaptured at up to 25%, and gains may owe capital-gains tax (a 1031 exchange can defer both). Figures are a year-1 estimate at your 24.0% rate — not tax advice; consult a CPA.
Condition & rehab AI · 2 photos
This single-story home is in excellent condition with no visible repairs needed. It offers a good investment opportunity with potential for minor updates to enhance its curb appeal and value.
Value-add opportunities
- Both Paint exterior and interior walls — Fresh paint enhances curb appeal and interior aesthetics
- Both Install new landscaping — Landscaping improves curb appeal and adds value
- Both Add smart home features — Smart home features increase convenience and appeal to potential buyers/renters
Renovation cost estimate screening
Value-add ROI direction
- Both Paint exterior and interior walls — Fresh paint enhances curb appeal and interior aesthetics ↑
- Both Install new landscaping — Landscaping improves curb appeal and adds value ↑
- Both Add smart home features — Smart home features increase convenience and appeal to potential buyers/renters ↑
ⓘ Cost ranges are severity-bucket heuristics (US national rule-of-thumb). Get contractor quotes + a written scope before underwriting a rehab budget.
Schools (NCES district)
- District
- Community ISD
- NCES district ID
- 4814850
- Math proficiency
- 30% ▼ -23.00%
- Reading proficiency
- 38% ▼ -11.00%
- Median HH income
- $71,841
- Composite
- 31.58/100
- National rank
- #5951
- State rank
- #479 of 826 in TX
Livability — Lavon
- Score
- 66/100
- State rank
- #588
- US rank
- #11230
Category grades
Schools grade is shown separately in the Schools card above.
Census & demographics
- County
- Collin County · 1,159,394 people
- City population
- 6,989
- Metro
- Dallas-Fort Worth-Arlington, TX
- Population (ZIP)
- 6,989
- Household income
- $132,101
- Rent vs Own
- Severe rent burden
- 41.0
Population outlook (Collin County) Hauer SSP2
- Today (2025)
- 1,210,074 people
- By 2030
- 1,358,201 · +12.2%
- By 2040
- 1,654,061 · +36.7%
- By 2050
- 1,937,359 · +60.1%
- By 2075
- 2,567,039 · +112.1%
- By 2100
- 2,952,048 · +144.0%
Race, ethnicity, and origin ACS 2023
- Neighborhood character
- Diverse neighborhood (Simpson 0.63)
- Race & ethnicity
- White 55% Hispanic / Latino 24% Two or more races 15% Black 7% Asian 4% Native American 2% Pacific Islander 1%
- Hispanic origin (detail)
- Mexican 15% Puerto Rican 3%
- Common ancestry
- Slovak 2% Serbian 2% Lithuanian 2%
- Foreign-born
- 8% · Canada
- Languages at home
- 84% English-only · Spanish 11% Other Indo-European 3% Arabic 1%
Political lean MEDSL · Collin
- 2024 margin
- R (+11.1) · D 43.1% · R 54.3% · Other 2.6%
- 2008→2024 swing
- +14.4pp toward D · 2008: -25.6pp · 2024: -11.1pp
- All cycles
- 2024: R+11.1 2020: R+4.3 2016: R+17.0 2012: R+31.6 2008: R+25.6
Not yet ingested
- Civics
- —
Market trends
- HPI YoY
- ▼ -24.22%
- Current HPI
- 221.0
- Rent YoY
- —
- Metro
- Dallas-Fort Worth-Arlington, TX
- State GDP YoY
- ▲ 3.95%
- F500 in state
- 110
Industry mix (Fortune 500 HQ in TX)
| Industry | F500 HQs | Revenue |
|---|---|---|
| Energy | 16 | $1,198B |
|
||
| Technology | 5 | $198B |
|
||
| Engineering / Construction | 4 | $72B |
|
||
| Energy Services | 3 | $60B |
|
||
| Utilities | 3 | $41B |
|
||
| Healthcare | 2 | $330B |
|
||
Price history
-12.7% since first listed4 events — show timeline
- 2026-06-16 Price Changed $267,990 NTREIS
- 2026-05-13 Price Changed $277,990 NTREIS
- 2026-05-11 Price Changed $307,990 NTREIS
- 2026-04-30 Listed $306,990 NTREIS
Cash-flow waterfall
monthlySold comps — $/sqft
last 12 mo · ≤1 miLoading sold comps…