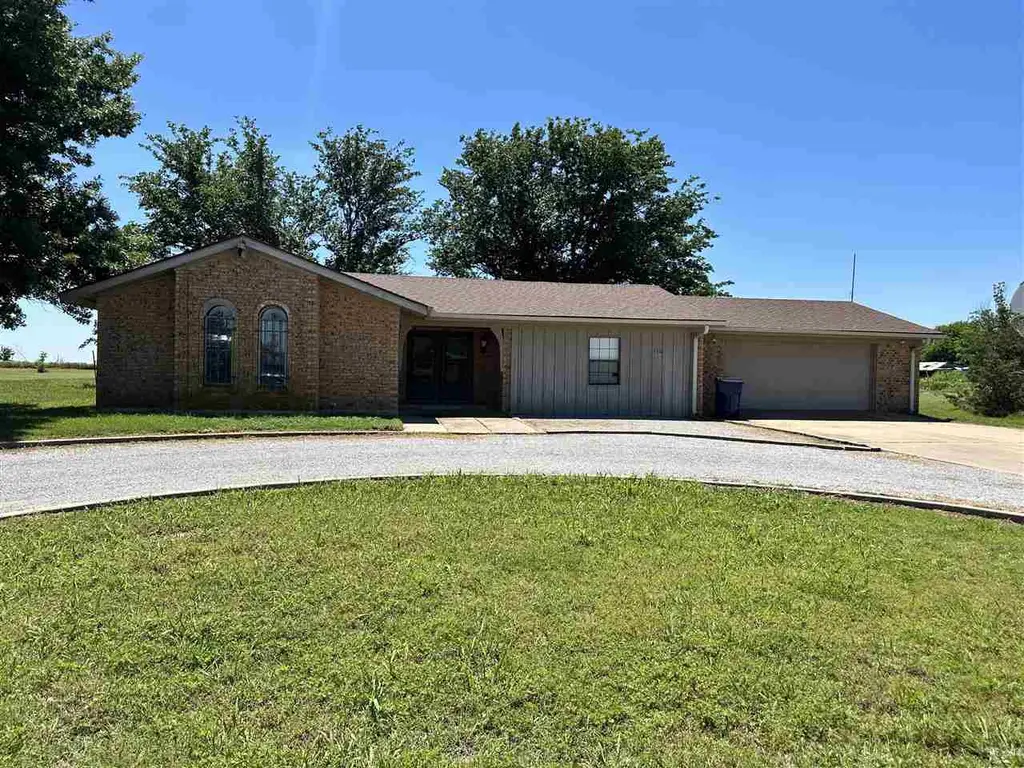
110 Wonder Dr · Walters, OK
Flood risk 1/10 · Minimal
- FEMA flood zone
- X
- Chance of flooding over 30 yrs
- 0.0%
- Est. flood insurance / yr
- $507 – $1,088
Fire risk 5/10 · Moderate
- Est. fire insurance / yr
- $2,463 – $4,575
Heat risk 7/10 · Major
- Hot days now (above 111°F)
- 7 days/yr
- Hot days in 30 yrs
- 18 days/yr
Wind risk 4/10 · Minor
- Chance of severe wind over 30 yrs
- 10.0%
Air-quality risk 1/10 · Minimal
- Unhealthy air days now
- 0 days/yr
- Unhealthy air days in 30 yrs
- 0 days/yr
Risk factors via First Street. Map © Google.
Why this score? — see what drove the D grade
The composite is a weighted blend of 9 inputs, each scored 0–100. Each bar is that input's sub-score; the figure is the points it added to the 100-point composite (weight × sub-score).
- Cash flow +11.5/30.0
- Appreciation +7.9/10.0
- ARV discount +7.5/15.0
- DSCR +3.4/10.0
- Livability +3.2/5.0
- Rent growth +2.5/5.0
- Condition / age +2.5/5.0
- 1% rule +2.3/10.0
- Schools +2.1/10.0
$160,000
🖨 Deal sheet (PDF) 📄 Offer letter ✓ Due diligence
Listing remarks
Charming Country Living In Walters, OK! Welcome to this spacious 3-bedroom, 2-bath brick home built in 1975, offering approximately 1,600 square feet of living space on a large lot of nearly one acre in the peaceful small-town community of Walters, Oklahoma. Located just inside city limits and within the Walters Public School District, this total electric property is priced to sell at just $160,000 and offers incredible potential as a forever home or continued income-producing rental property. Inside, you’ll find: ? Two separate living areas ? Vaulted/peaked ceilings in the main sunken living room ? Beautiful wood paneling and built-in cabinetry in the second living area ? Wrought i
Key facts
- Wrought iron railing
- Built-in cabinetry
- Large lot
Tags
Property features AI
Exterior
- Parking: 2 total parking spaces; 2 covered spaces; 2-car garage with garage door opener; Circular driveway; Also has open parking
- Security: Smoke detector(s); Carbon monoxide detector(s)
- Utilities: Public water; Septic tank sewer
- Home design: Single family residence; One story
- Construction: Brick veneer construction; Composition roof; Slab foundation; Built as a residential single family home
- Exterior features: Patio; Storm door(s); Public maintained road frontage on a city street; R-1 single family zoning
Interior
- Kitchen: Cooktop; Oven; Refrigerator; Electric water heater
- Flooring: Ceramic tile; Carpet; Laminate
- Bathrooms: 1 full bathroom; 1 three-quarter bathroom
- Heating & cooling: Central heating (electric); Central air; Ceiling fans; Electric cooling
- Interior features: Walk-in closets; Smoke and carbon monoxide detectors
- Laundry & utility: Washer hookup
Neighborhood map
What this means for you Summary
Snapshot
- This is a 3-bed/2.0-bath single-family listed at $160k.
Deal economics
- At list price, monthly cash flow is $-51 ($-618/yr) — negative.
- To cash-flow at today's rent, offer at most $151k (5.7% below list).
- To meet the 1% rule (rent ≥ 1% of price), the offer needs to be $117k (26.9% below list).
- Recommended offer: $117k (26.9% below list) — sets the bar for 1% rule.
Location & tenants
- Location reads 64/100 on livability (#165 in OK) — a middle-class / working-renter tenant base. Strengths: cost of living A+, housing A+; Watch: employment D, amenities F, commute F.
- Walters (town): math 22% / reading 25% proficiency, ranked #122 of 270 in OK (top 45%) — low school quality limits family demand, transient renter base, plan for 1-2y turnover.
- Zoned schools: Walters Es (math 37% / reading 27%, grade F, #213 of 845 statewide, top 28%, 274 students, 0% FRL); Walters Ms (math 12% / reading 22%, grade F, #193 of 345 statewide, top 60%, 140 students, 0% FRL); Walters Hs (math 15% / reading 24%, grade F, #274 of 447 statewide, top 66%, 196 students, 0% FRL) — zoned schools average 0% FRL vs 49% district-wide (49 pts lower); this property's tenant base skews higher-income than the district average.
- Market conditions: 19 active listings in the ZIP.
Forward outlook
- In year one you build about $10k of equity ($1k loan paydown + $9k appreciation (5.9% local appreciation)).
- Cotton County population projected to shrink 5% by 2050 — rents likely to lag national; underwrite the cash flow, not the appreciation.
- At projected returns (5.9% appreciation + 3.0% rent growth), your $45k cash investment doubles in ~4 years — after that, you're playing with house money.
- By year 4, paydown + projected appreciation supports a ~$36k cash-out refi (75% LTV) — recoverable capital for the next deal without selling this one.
Negotiation context
- Only 6 days on market — expect competitive offers; lowballing is unlikely to land.
- Current owner paid $65k; list at $160k implies a 146% gain — meaningful room to come down on a strong offer.
Risks & watch-outs
- Climate carrying-cost: moderate wildfire risk; extreme-heat days projected 7→18/yr by 2055 (HVAC capex compounding) — expect insurance premiums to compound above CPI over the hold.
Questions for the listing agent
- What do current leases actually rent for vs. the listed asking? Can we see a recent rent roll and the last 12 months of T-12 income?
- Built in 1975 — when were the roof, HVAC, electrical panel, plumbing, and water heater last replaced?
- Is there a deadline driving the sale (1031 exchange, divorce, estate, relocation)? That informs how much negotiation room exists.
- Schools are F-rated, which usually means shorter tenancies and higher turnover. Who's the typical renter profile here, and what's been the actual vacancy rate?
- The area grade is low — what's the realistic commute time and amenity access for the typical tenant pool here? Any planned neighborhood developments (good or bad) we should know about?
- What's the average days-on-market for RENTAL listings here right now (not sales)? A rising rental-DOM trend means longer vacancies and softer asking-rent achievability than the comps imply.
- What's the recent tenant-quality profile in this submarket — average credit score on applications, eviction rate, late-payment / NSF rate, and stable-employment percentage? A property-management company in the area should have these aggregated.
- How much new for-sale + rental construction is in the pipeline within 1–3 miles? Heavy new supply typically softens prices + rents 12–24 months out; constrained supply supports both.
Investment metrics
- 1% rule
- 0.73% ✗
- Cap rate
- 5.91%
- Cash-on-cash
- -1.38%
- DSCR
- 0.94
- GRM
- 11.4
CMA / ARV
No comps found within radius.
Projected returns pro-forma
5.87% appreciation · 3.0% rent growth · sell at horizon
- IRR
- 13.9%
- Equity multiple
- 1.93×
- Total profit
- $41,583
- Equity at exit
- $99,230
- IRR
- 14.3%
- Equity multiple
- 3.79×
- Total profit
- $125,101
- Equity at exit
- $178,793
Cash invested: $44,800 (down + closing). Projections, not guarantees.
Landlord ↔ Tenant lean methodology
- Overall (STATE)
- 83 Strongly Landlord-Friendly
- State Oklahoma
- 83 Strongly Landlord-Friendly · R+20
- County
- — inherits STATE
- City
- — inherits STATE
ZIP-level market 73572
- Home prices YoY
- 3.1%
- Active inventory
- 19
- Price-to-rent
- 11.4×
Monthly cashflow live
- Estimated rent
- $1,170 medium interval (Pro) →
- Mortgage (P&I)
- −$839
- Tax from tax record
- −$70 /mo · $840/yr
- Insurance
- −$67
- HOA
- −$0
- Vacancy / Maint / Mgmt
- −$246
- Net cashflow
- $-51
Break-even live
Sensitivity live
| Price | -10% $39 | -5% $-6 | +0% $-51 | +5% $-97 | +10% $-142 |
|---|---|---|---|---|---|
| Rent | -10% $-144 | -5% $-98 | +0% $-51 | +5% $-5 | +10% $41 |
| Rate | -1.0pp $29 | -0.5pp $-11 | base $-51 | +0.5pp $-93 | +1.0pp $-135 |
UW: 25.0% down · 7.5% · 30yr · 1.5% tax · 5.0% vac · 8.0% maint · 8.0% mgmt
Financing live
Cash to close
- Down payment
- $40,000
- Closing costs
- $4,800
- Reserves months
- —
- Total cash needed
- —
Loan-product check · same deal, 3 products live
Conventional
25% down · 7.5% · 30yr
- Down + closing
- —
- Monthly P&I
- —
- Monthly cashflow
- —
- DSCR
- —
- Eligible?
- —
Personal DTI + credit; lowest rate.
DSCR
20% down · 8.5% · 30yr
- Down + closing
- —
- Monthly P&I
- —
- Monthly cashflow
- —
- DSCR
- —
- Eligible?
- —
No personal income docs; deal must DSCR.
Hard money
10% down · 12.0% · 12mo
- Down + closing
- —
- Monthly P&I
- —
- Monthly cashflow
- —
- DSCR
- —
- Eligible?
- —
Short-term bridge; refi at stabilization.
Listing history 7 events
-
2026-06-18status $160,000 Pending 6 DOM
-
2026-06-18days on market $160,000 Active 6 DOM
-
2026-06-17days on market $160,000 Active 5 DOM
-
2026-06-16days on market $160,000 Active 4 DOM
-
2026-06-15days on market $160,000 Active 3 DOM
-
2026-06-13remarks 693-char remark
-
2026-06-13$160,000 Active 1 DOM
ⓘ Source: listings_history table (triggers on properties + properties_extension) + one-shot
backfill from property_details.listing_events for pre-trigger history.
Tax reassessment forecast OK · Resets to sale price
- Current annual tax
- $840 · $70/mo
- Projected year-2 tax
- $1,440 · $120/mo
- Expected delta
- +$600/yr (+$50/mo · 71.4%)
ⓘ Screening estimate from a state-policy table — verify with the county assessor before closing.
Climate risk First Street
- Flood 1/10 Low FEMA zone X · 0% chance over 30 yrs
- Wildfire 5/10 Major
- Heat 7/10 Severe 7 d/yr ≥111°F today · 18 d/yr by 30 yrs out
- Wind 4/10 Moderate 10% chance of damaging wind over 30 yrs
- Air quality 1/10 Low 0 unhealthy d/yr today · 0 by 30 yrs out
Nearby sold comps map
Loading sold comps map…
Walkable amenities ~0.75 mi
Loading nearby amenities…
Taxation est. · year 1
- Rental income
- $14,039
- − Mortgage interest
- −$8,962
- − Property taxes
- −$840
- − Insurance
- −$800
- − Repairs & maintenance
- −$1,123
- − Management
- −$1,123
- − Depreciation
- −$4,655
- Taxable loss
- −$3,464
- Est. tax savings @ 24.0%
- +$831
- After-tax cash flow
- $214/yr
For passive investors: Depreciation is non-cash, so a rental often shows a tax loss while cash-flowing — sheltering income. Rental losses are passive: they offset passive income freely, and up to $25,000/yr can offset ordinary (W-2) income if you actively participate and your MAGI is under $100k (phasing out to $0 by $150k); unused losses carry forward. On sale, claimed depreciation is recaptured at up to 25%, and gains may owe capital-gains tax (a 1031 exchange can defer both). Figures are a year-1 estimate at your 24.0% rate — not tax advice; consult a CPA.
Schools (NCES district)
- District
- Walters
- NCES district ID
- 4031470
- Math proficiency
- 22% ▼ -4.00%
- Reading proficiency
- 25% ▼ -3.00%
- Median HH income
- $48,681
- Composite
- 20.68/100
- National rank
- #8530
- State rank
- #122 of 270 in OK
Livability — Walters
- Score
- 64/100
- State rank
- #165
- US rank
- #13750
Category grades
Schools grade is shown separately in the Schools card above.
Census & demographics
- Census place
- Walters, OK
- Population (ZIP)
- 3,194
Population outlook (Cotton County) Hauer SSP2
- Today (2025)
- 5,847 people
- By 2030
- 5,759 · -1.5%
- By 2040
- 5,619 · -3.9%
- By 2050
- 5,550 · -5.1%
- By 2075
- 5,839 · -0.1%
- By 2100
- 6,503 · +11.2%
Race, ethnicity, and origin ACS 2023
- Neighborhood character
- Predominantly White (72%)
- Race & ethnicity
- White 72% Native American 12% Two or more races 10% Hispanic / Latino 6%
- Hispanic origin (detail)
- Mexican 5%
- Common ancestry
- Iranian 2% Italian 2% European 1%
- Foreign-born
- 1% · Canada
- Languages at home
- 92% English-only · Spanish 5%
Political lean MEDSL · Cotton
- 2024 margin
- Solid R (+66.8) · D 15.6% · R 82.5% · Other 1.9%
- 2008→2024 swing
- -22.4pp toward R · 2008: -44.4pp · 2024: -66.8pp
- All cycles
- 2024: R+66.8 2020: R+67.0 2016: R+62.6 2012: R+46.4 2008: R+44.4
Not yet ingested
- Civics
- —
Market trends
- HPI YoY
- ▲ 5.87%
- Current HPI
- 193.3992
- Rent YoY
- —
- Metro
- —
- State GDP YoY
- ▲ 1.55%
- F500 in state
- 6
Industry mix (Fortune 500 HQ in OK)
| Industry | F500 HQs | Revenue |
|---|---|---|
| Energy | 3 | $48B |
|
||
Price history
+146.2% since first listed2 events — show timeline
- 2026-06-04 Listed $160,000 LBRMLS
- 2003-03-19 Sold (Public Records) $65,000 Public Records
Property tax history
+1.1%/yrLatest (2025): $840 · +5.1% YoY. Source: county tax records.
Cash-flow waterfall
monthlySold comps — $/sqft
last 12 mo · ≤1 miLoading sold comps…