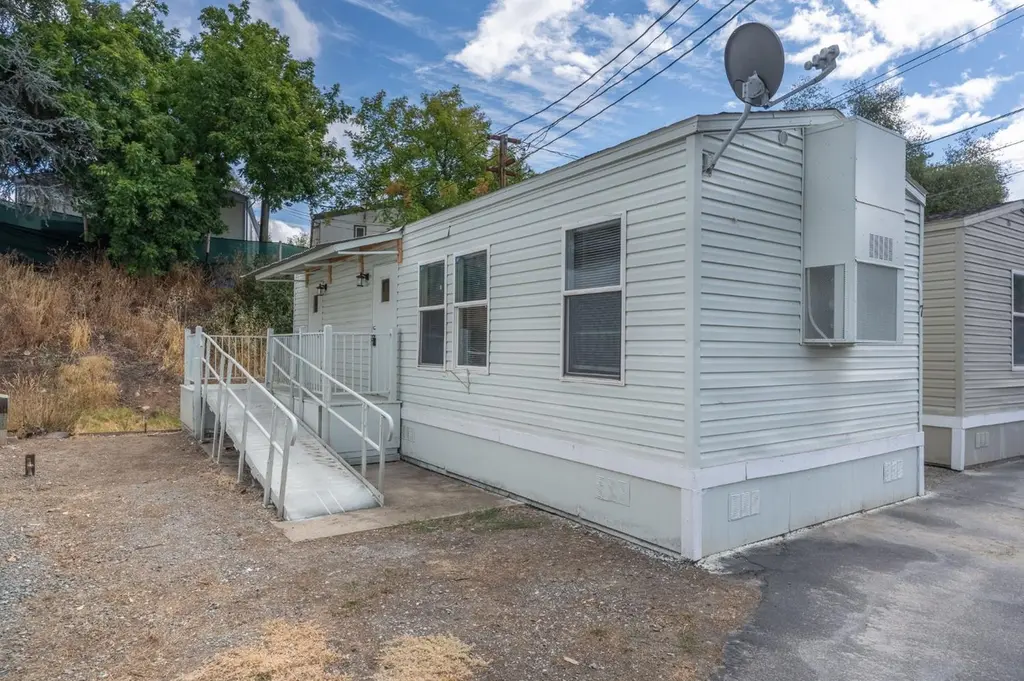
607 Mountain Ranch Rd #7 · San Andreas, CA
Flood risk 9/10 · Severe
- FEMA flood zone
- X (unshaded)
- Chance of flooding over 30 yrs
- 0.99%
- Est. flood insurance / yr
- $507 – $1,088
Fire risk 9/10 · Severe
- Est. fire insurance / yr
- $659 – $1,223
Heat risk 7/10 · Major
- Hot days now (above 103°F)
- 7 days/yr
- Hot days in 30 yrs
- 16 days/yr
Wind risk 1/10 · Minimal
- Chance of severe wind over 30 yrs
- —
Air-quality risk 10/10 · Severe
- Unhealthy air days now
- 27 days/yr
- Unhealthy air days in 30 yrs
- 30 days/yr
Risk factors via First Street. Map © Google.
Why this score? — see what drove the C grade
The composite is a weighted blend of 9 inputs, each scored 0–100. Each bar is that input's sub-score; the figure is the points it added to the 100-point composite (weight × sub-score).
- Cash flow +30.0/30.0
- 1% rule +10.0/10.0
- DSCR +10.0/10.0
- Condition / age +2.8/5.0
- Livability +2.6/5.0
- Rent growth +2.5/5.0
- Schools +2.0/10.0
- ARV discount +0.0/15.0
- Appreciation +0.0/10.0
$29,950
🖨 Deal sheet 📄 Offer letter ✓ Due diligence
Listing remarks
This is a Park Model Home (H & S 18009.3) This 2009 park model home offers 2 bedrooms and 1 bathroom in the welcoming town of San Andreas. The open living area is filled with natural light, creating a warm and inviting space. Enjoy the peaceful setting of the community while still being close to local amenities, schools, and the scenic beauty of Calaveras County. Space rent is just $595, making this home a very affordable option.
Key facts
- Scenic beauty
- Natural light
- Open living area
Tags
Neighborhood map
What this means for you Summary
Snapshot
- This is a 2-bed/1.0-bath manufactured listed at $30k. Condition is rated average.
Deal economics
- At list price, monthly cash flow is $639 ($8k/yr) — positive.
- The deal already cash-flows at list — no discount required.
- Meets the 1% rule at list price ($1k rent vs $30k).
- Recommended offer: $26k (12.0% below list) — sets the bar for market timing.
- Cap rate 34.5% vs local median 2.9% in San Andreas — top-decile yield for the area; either an underpriced asset or a hidden risk that comps aren't pricing in. Stress-test before assuming the spread holds.
Location & tenants
- Location reads 52/100 on livability (#1,033 in CA) — a working-class tenant base; expect higher turnover. Watch: schools D, employment D, amenities F.
- Calaveras Unified (rural): math 16% / reading 28% proficiency, ranked #436 of 517 in CA (top 84%) — low school quality limits family demand, transient renter base, plan for 1-2y turnover.
- Market conditions: 46 active listings in the ZIP; 77 units permitted in Calaveras County in 2024 (0 in 5+ unit buildings).
Forward outlook
- Local home prices are declining (-3.0%/yr); year-one equity from $208 of loan paydown is wiped out by about $898 of value loss. Plan a longer hold.
- Calaveras County population projected at -18% by 2050 — secular population decline; favor cash flow + early exit over multi-decade hold.
- At projected returns (-3.0% appreciation + 3.0% rent growth), your $8k cash investment doubles in ~2 years — after that, you're playing with house money.
Negotiation context
- It's been on market 210 days — a 12% lower offer ($26k) is reasonable based on typical stale-listing flexibility.
Risks & watch-outs
- Watch-outs: flood insurance adds $66/mo.
- Climate carrying-cost: severe flood risk; severe wildfire risk; extreme-heat days projected 7→16/yr by 2055 (HVAC capex compounding) — expect insurance premiums to compound above CPI over the hold.
Questions for the listing agent
- It's been on market 210 days. Have you received any prior offers? Is the seller open to a 12% concession, seller financing, or rate buy-down credit?
- What's the actual annual flood-insurance premium (NFIP or private), and is the property in a SFHA with mandatory coverage?
- Why hasn't it sold? Are there any deal-killer items the seller is aware of (foundation, flood, title, zoning, code violations)?
- Is there a deadline driving the sale (1031 exchange, divorce, estate, relocation)? That informs how much negotiation room exists.
- Schools are D-rated, which usually means shorter tenancies and higher turnover. Who's the typical renter profile here, and what's been the actual vacancy rate?
- What's the average days-on-market for RENTAL listings here right now (not sales)? A rising rental-DOM trend means longer vacancies and softer asking-rent achievability than the comps imply.
- What's the recent tenant-quality profile in this submarket — average credit score on applications, eviction rate, late-payment / NSF rate, and stable-employment percentage? A property-management company in the area should have these aggregated.
- How much new for-sale + rental construction is in the pipeline within 1–3 miles? Heavy new supply typically softens prices + rents 12–24 months out; constrained supply supports both.
Investment metrics
- 1% rule
- 3.86% ✓
- Cap rate
- 34.55%
- Cash-on-cash
- 100.90%
- DSCR
- 5.49
- GRM
- 2.2
CMA / ARV
- ARV (median comp)
- $22,611
- List price
- $29,950
- Delta
- 32.46%
- Verdict
- OVERPRICED
- Comps
- 3 within 1.0 mi
Show comp detail 4 sales within ~0.75 mi
| Address | Dist | Beds/Ba | Sqft | Sold | Price | $/sf | Match |
|---|---|---|---|---|---|---|---|
| 607 Mountain Ranch Rd #23 | 0.00mi | 2/1.0 | 400 (-2%) | 2mo | $18,000 | $45 | 95 |
| 607 Mountain Ranch Rd #8 | 0.00mi | 2/1.0 | 400 (-2%) | 9mo | $22,950 | $57 | 89 |
| 607 Mountain Ranch Rd #5 | 0.00mi | 1/1.0 (-1) | 434 (+6%) | 4mo | $32,000 | $74 | 82 |
| 607 Mountain Ranch Rd #1 | 0.00mi | 2/1.0 | 400 (-2%) | 19mo | $32,000 | $80 | 81 |
Match score weights: distance 35% · size 25% · config 20% · recency 20%. Top-matched comps best support the ARV.
Projected returns pro-forma
-3.0% appreciation · 3.0% rent growth · sell at horizon
- IRR
- 92.2%
- Equity multiple
- 5.28×
- Total profit
- $35,884
- Equity at exit
- $4,466
- IRR
- 95.0%
- Equity multiple
- 11.00×
- Total profit
- $83,865
- Equity at exit
- $2,590
Cash invested: $8,386 (down + closing). Projections, not guarantees.
Landlord ↔ Tenant lean methodology
- Overall (STATE)
- 18 Strongly Tenant-Friendly
- State California
- 18 Strongly Tenant-Friendly · D+13
- County
- — inherits STATE
- City
- — inherits STATE
ZIP-level market 95249
- Home prices YoY
- -19.6%
- Active inventory
- 46
- Price-to-rent
- 2.2×
Monthly cashflow live
- Estimated rent
- $1,155 medium interval (Pro) →
- Mortgage (P&I)
- −$157
- Tax est. 1.5%
- −$37 /mo · $449/yr
- Insurance
- −$12
- Flood insurance flood zone
- −$66 /mo · $798/yr
- HOA
- −$0
- Vacancy / Maint / Mgmt
- −$242
- Net cashflow
- $639
Break-even live
UW: 25.0% down · 7.5% · 30yr · 1.5% tax · 5.0% vac · 8.0% maint · 8.0% mgmt
Financing live
Cash to close
- Down payment
- $7,488
- Closing costs
- $898
- Reserves months
- —
- Total cash needed
- —
Loan-product check · same deal, 3 products live
Conventional
25% down · 7.5% · 30yr
- Down + closing
- —
- Monthly P&I
- —
- Monthly cashflow
- —
- DSCR
- —
- Eligible?
- —
Personal DTI + credit; lowest rate.
DSCR
20% down · 8.5% · 30yr
- Down + closing
- —
- Monthly P&I
- —
- Monthly cashflow
- —
- DSCR
- —
- Eligible?
- —
No personal income docs; deal must DSCR.
Hard money
10% down · 12.0% · 12mo
- Down + closing
- —
- Monthly P&I
- —
- Monthly cashflow
- —
- DSCR
- —
- Eligible?
- —
Short-term bridge; refi at stabilization.
Listing history 15 events
-
2026-06-17status $29,950 Pending 210 DOM
-
2026-06-17days on market $29,950 Active 210 DOM
-
2026-06-16days on market $29,950 Active 209 DOM
-
2026-06-15days on market $29,950 Active 208 DOM
-
2026-06-14days on market $29,950 Active 206 DOM
-
2026-06-12days on market $29,950 Active 205 DOM
-
2026-06-09days on market $29,950 Active 202 DOM
-
2026-06-08days on market $29,950 Active 201 DOM
-
2026-06-07days on market $29,950 Active 200 DOM
-
2026-06-07days on market $29,950 Active 199 DOM
-
2026-06-04days on market $29,950 Active 196 DOM
-
2026-06-02days on market $29,950 Active 195 DOM
-
2026-06-01days on market $29,950 Active 194 DOM
-
2026-05-31days on market $29,950 Active 193 DOM
-
2026-05-31days on market $29,950 Active 192 DOM
ⓘ Source: listings_history table (triggers on properties + properties_extension) + one-shot
backfill from property_details.listing_events for pre-trigger history.
Climate risk First Street
- Flood 9/10 Extreme FEMA zone X (unshaded) · 99% chance over 30 yrs
- Wildfire 9/10 Extreme
- Heat 7/10 Severe 7 d/yr ≥103°F today · 16 d/yr by 30 yrs out
- Wind 1/10 Low
- Air quality 10/10 Extreme 27 unhealthy d/yr today · 30 by 30 yrs out
Nearby sold comps map
Loading sold comps map…
Walkable amenities ~0.75 mi
Loading nearby amenities…
Taxation est. · year 1
- Rental income
- $13,855
- − Mortgage interest
- −$1,678
- − Property taxes
- −$449
- − Insurance
- −$947
- − Repairs & maintenance
- −$1,108
- − Management
- −$1,108
- − Depreciation
- −$871
- Taxable income
- $7,693
- Est. tax owed @ 24.0%
- −$1,846
- After-tax cash flow
- $5,818/yr
For passive investors: Depreciation is non-cash, so a rental often shows a tax loss while cash-flowing — sheltering income. Rental losses are passive: they offset passive income freely, and up to $25,000/yr can offset ordinary (W-2) income if you actively participate and your MAGI is under $100k (phasing out to $0 by $150k); unused losses carry forward. On sale, claimed depreciation is recaptured at up to 25%, and gains may owe capital-gains tax (a 1031 exchange can defer both). Figures are a year-1 estimate at your 24.0% rate — not tax advice; consult a CPA.
Condition & rehab AI · 12 photos
This park model home is in average condition with cosmetic updates needed to enhance its resale and rental value.
Repairs flagged
- Minor kitchen appliances — basic appliances
- Minor bathroom fixtures — basic fixtures
Value-add opportunities
- Both paint interior walls — enhances curb appeal and interior aesthetics
- Both replace carpet with hardwood — improves durability and aesthetics
- Both update kitchen appliances — enhances functionality and appeal
- Both update bathroom fixtures — enhances functionality and appeal
Renovation cost estimate screening
| Repair item | Severity | Est. cost |
|---|---|---|
| kitchen appliances · basic appliances | Minor | $500–3,000 |
| bathroom fixtures · basic fixtures | Minor | $500–3,000 |
| Total estimated repair cost · 2 items | $1,000–6,000 |
Value-add ROI direction
- Both paint interior walls — enhances curb appeal and interior aesthetics ↑
- Both replace carpet with hardwood — improves durability and aesthetics ↑
- Both update kitchen appliances — enhances functionality and appeal ↑
- Both update bathroom fixtures — enhances functionality and appeal ↑
ⓘ Cost ranges are severity-bucket heuristics (US national rule-of-thumb). Get contractor quotes + a written scope before underwriting a rehab budget.
Schools (NCES district)
- District
- Calaveras Unified
- NCES district ID
- 0606870
- Math proficiency
- 16% ▼ -10.00%
- Reading proficiency
- 28% ▼ -8.00%
- Median HH income
- $55,559
- Composite
- 20.06/100
- National rank
- #8654
- State rank
- #436 of 517 in CA
Livability — San Andreas
- Score
- 52/100
- State rank
- #1033
- US rank
- #25053
Category grades
Schools grade is shown separately in the Schools card above.
Census & demographics
- Census place
- San Andreas, CA
- Population (ZIP)
- 4,696
Population outlook (Calaveras County) Hauer SSP2
- Today (2025)
- 43,163 people
- By 2030
- 41,703 · -3.4%
- By 2040
- 38,202 · -11.5%
- By 2050
- 35,385 · -18.0%
- By 2075
- 30,807 · -28.6%
- By 2100
- 25,755 · -40.3%
Race, ethnicity, and origin ACS 2023
- Neighborhood character
- Predominantly White (75%)
- Race & ethnicity
- White 75% Hispanic / Latino 13% Two or more races 7% Asian 4% Black 1% Native American 1%
- Hispanic origin (detail)
- Mexican 12%
- Common ancestry
- Lithuanian 5% Slovak 4% Iranian 3%
- Foreign-born
- 8% · Canada, China
- Languages at home
- 91% English-only · Spanish 4% Chinese 2% Other Indo-European 1%
Political lean MEDSL · Calaveras
- 2024 margin
- Strong R (+28.1) · D 34.7% · R 62.8% · Other 2.5%
- 2008→2024 swing
- -15.2pp toward R · 2008: -13.0pp · 2024: -28.1pp
- All cycles
- 2024: R+28.1 2020: R+23.8 2016: R+23.9 2012: R+17.0 2008: R+13.0
Not yet ingested
- Civics
- —
Market trends
- HPI YoY
- ▼ -48.12%
- Current HPI
- 196.6959
- Rent YoY
- —
- Metro
- —
- State GDP YoY
- ▲ 3.21%
- F500 in state
- 116
Industry mix (Fortune 500 HQ in CA)
| Industry | F500 HQs | Revenue |
|---|---|---|
| Technology | 27 | $1,492B |
|
||
| Financial Services | 3 | $174B |
|
||
| Retail | 3 | $44B |
|
||
| Insurance | 3 | $26B |
|
||
| Media / Entertainment | 2 | $115B |
|
||
| Pharmaceuticals / Biotech | 2 | $62B |
|
||
Cash-flow waterfall
monthlySold comps — $/sqft
last 12 mo · ≤1 miLoading sold comps…