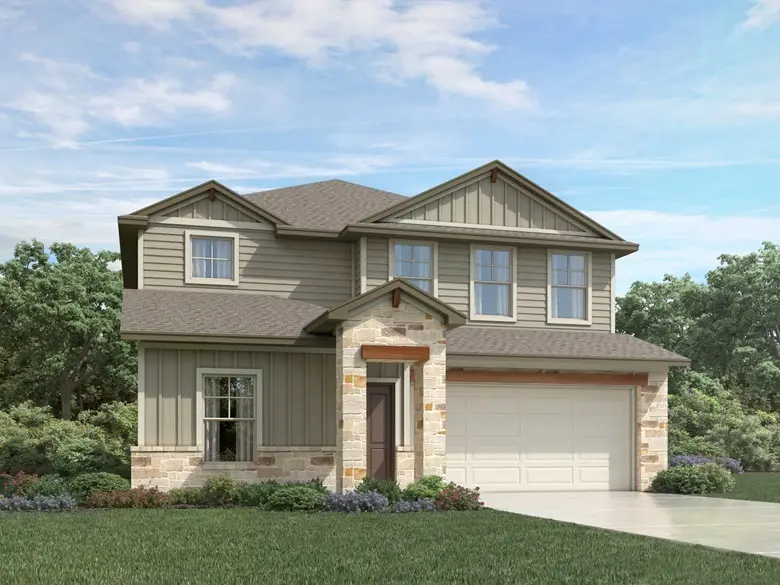
212 Windfall Trl · Santa Rita Ranch, TX
Flood risk No data
- FEMA flood zone
- —
- Chance of flooding over 30 yrs
- —
- Est. flood insurance / yr
- —
Fire risk No data
- Est. fire insurance / yr
- —
Heat risk No data
- Hot days now (above threshold)
- —
- Hot days in 30 yrs
- —
Wind risk No data
- Chance of severe wind over 30 yrs
- —
Air-quality risk No data
- Unhealthy air days now
- —
- Unhealthy air days in 30 yrs
- —
Risk factors via First Street. Map © Google.
Why this score? — see what drove the D- grade
The composite is a weighted blend of 9 inputs, each scored 0–100. Each bar is that input's sub-score; the figure is the points it added to the 100-point composite (weight × sub-score).
- ARV discount +15.0/15.0
- Cash flow +8.2/30.0
- Schools +4.4/10.0
- 1% rule +2.7/10.0
- Livability +2.5/5.0
- Condition / age +2.5/5.0
- DSCR +2.2/10.0
- Rent growth +2.0/5.0
- Appreciation +0.0/10.0
$399,990
🖨 Deal sheet (PDF) 📄 Offer letter ✓ Due diligence
Listing remarks MLS
The open kitchen and family room provide the perfect gathering space for all occasions. Gray cabinets with marble-look white quartz countertops, warm beige EVP flooring, and multi-tone taupe carpet in our Radiant package.
Key facts
- Covered patios
- Family room
- Walk-in showers
Tags
Property features AI
Finance
- HOA & community: Homeowners association managed by Goodwin Management; Quarterly HOA fee of $123 covering common area maintenance; Community features include a park and street lights
Exterior
- Parking: Two-car garage with front-facing door and automatic opener; Total of four parking spaces, two covered
- Security: Fire alarm; Smoke detectors
- Utilities: Public water; Public sewer; Electricity available; Natural gas available; Fiber optic available; Underground utilities
- Home design: Two-story home; Northwest-facing; Under construction; Has a view
- Construction: Composition roof; Board and batten, cement/HardiPlank-type siding; Low VOC insulation and spray foam insulation; Built by Meritage Homes; Slab foundation
- Exterior features: Rear porch; In-wall pest control system; Exterior lighting; Small trees in yard; Sprinklers front, rear, side and partial coverage; Fenced private pool
Interior
- Kitchen: Kitchen island; Granite and quartz counters; Kitchen/family room combo; Dining area; Microwave; Plumbed for ice maker; Stainless steel appliances; Vented exhaust fan; Gas range
- Bedrooms: Two main-level bedrooms; Ceiling fan(s) in at least one main-level room
- Flooring: Vinyl flooring; Wood flooring
- Bathrooms: Three full bathrooms; Double vanity in primary bath
- Heating & cooling: Central air conditioning; Electric heating
- Interior features: Blinds on windows; Accessible doors; Multiple living areas; Main level primary bedroom; Open floorplan; Pantry; Recessed lighting; Smart home features including smart thermostat; Double vanities
- Laundry & utility: Main-level laundry; Gas dryer hookup; Tankless gas water heater; Gas water heater
Neighborhood map
What this means for you Summary
Snapshot
- This is a 5-bed/3.0-bath single-family listed at $400k.
Deal economics
- At list price, monthly cash flow is $-378 ($-5k/yr) — negative.
- To cash-flow at today's rent, offer at most $345k (13.7% below list).
- To meet the 1% rule (rent ≥ 1% of price), the offer needs to be $307k (23.2% below list).
- Recommended offer: $307k (23.2% below list) — sets the bar for 1% rule.
- Cap rate 5.2% vs local median 2.2% in Santa Rita Ranch — top-decile yield for the area; either an underpriced asset or a hidden risk that comps aren't pricing in. Stress-test before assuming the spread holds.
Location & tenants
- Location reads: area grade D — affects rentability + tenant quality, not the cash-flow math above.
- Liberty Hill ISD (rural): math 43% / reading 52% proficiency, ranked #160 of 826 in TX (top 19%) — families likely to look elsewhere, expect single-tenant / working-renter base with shorter leases.
- Zoned schools: Wolf Ranch El (math 37% / reading 42%, grade F, #1,545 of 4,322 statewide, top 38%, 848 students, 28% FRL); James Tippit Middle (math 26% / reading 33%, grade F, #1,077 of 1,662 statewide, top 66%, 628 students, 49% FRL); East View H S (math 23% / reading 32%, grade F, #1,183 of 1,632 statewide, top 73%, 2,075 students, 41% FRL) — zoned schools average 39% FRL vs 21% district-wide (18 pts higher); higher-poverty schools than district average — tighter screening recommended.
- Zoned-school proficiency averages 32% at this address vs 48% district-wide (-15 pts) — the specific schools serving this property underperform the Liberty Hill ISD average; the district grade overstates school quality for this exact location.
- Market conditions: Rents soft (-1.9%/yr); 1509 active listings in the ZIP; 9 comparable units currently listed for rent nearby; rentals lingering (median 46d on market — plan ~5-8 weeks vacancy on turnover, expect pricing pressure); 67% of comp listings sitting > 30 days — soft ceiling on asking rent; high-income renter base; 7,543 units permitted in Williamson County in 2024 (1,425 in 5+ unit buildings).
Forward outlook
- Local home prices are declining (-3.0%/yr); year-one equity from $3k of loan paydown is wiped out by about $12k of value loss. Plan a longer hold.
- Williamson County population projected at +69% by 2050 — long-run rental-demand tailwind backs the buy-and-hold thesis.
Negotiation context
- It's been on market 45 days — a 3% lower offer ($388k) is reasonable based on typical stale-listing flexibility.
- 2 sale attempts; this cycle's ask has dropped $25k (6%) from the opening price — seller is motivated, your offer sets the floor, not the list.
Questions for the listing agent
- What do current leases actually rent for vs. the listed asking? Can we see a recent rent roll and the last 12 months of T-12 income?
- It's been on market 45 days. Have you received any prior offers? Is the seller open to a 23% concession, seller financing, or rate buy-down credit?
- What does the HOA fee cover, when was the last increase, and are there any pending special assessments or reserve-fund shortfalls?
- Is there a deadline driving the sale (1031 exchange, divorce, estate, relocation)? That informs how much negotiation room exists.
- The area grade is low — what's the realistic commute time and amenity access for the typical tenant pool here? Any planned neighborhood developments (good or bad) we should know about?
- What's the average days-on-market for RENTAL listings here right now (not sales)? A rising rental-DOM trend means longer vacancies and softer asking-rent achievability than the comps imply.
- What's the recent tenant-quality profile in this submarket — average credit score on applications, eviction rate, late-payment / NSF rate, and stable-employment percentage? A property-management company in the area should have these aggregated.
- How much new for-sale + rental construction is in the pipeline within 1–3 miles? Heavy new supply typically softens prices + rents 12–24 months out; constrained supply supports both.
Investment metrics
- 1% rule
- 0.77% ✗
- Cap rate
- 5.16%
- Cash-on-cash
- -4.06%
- DSCR
- 0.82
- GRM
- 10.9
CMA / ARV
- ARV (median comp)
- $598,483
- List price
- $399,990
- Delta
- -33.17%
- Verdict
- UNDERPRICED
- Comps
- 20 within 1.0 mi
Show comp detail 12 sales within ~0.75 mi
| Address | Dist | Beds/Ba | Sqft | Sold | Price | $/sf | Match |
|---|---|---|---|---|---|---|---|
| 224 Menlo Bnd | 0.11mi | 4/3.0 (-1) | 2,634 (-8%) | 1mo | $469,000 | $178 | 76 |
| 125 Arcilla Pass | 0.45mi | 4/3.0 (-1) | 2,865 (+0%) | 0mo | $519,170 | $181 | 73 |
| 249 Menlo Bnd | 0.16mi | 5/4.0 | 2,585 (-9%) | 1mo | $514,900 | $199 | 72 |
| 209 Menlo Bnd | 0.08mi | 4/3.0 (-1) | 2,500 (-12%) | 1mo | $446,136 | $178 | 70 |
| 209 Pacific Grove Cir | 0.53mi | 4/3.0 (-1) | 2,838 (-0%) | 1mo | $629,990 | $222 | 69 |
| 208 Locklin Dr | 0.51mi | 4/3.5 (-1) | 2,858 (+0%) | 2mo | $535,000 | $187 | 68 |
| 121 Arcilla Pass | 0.48mi | 4/3.0 (-1) | 2,767 (-3%) | 1mo | $544,990 | $197 | 66 |
| 528 Palatino Bnd | 0.61mi | 5/4.0 | 2,888 (+1%) | 2mo | $504,990 | $175 | 64 |
| 160 Covered Bridge Trl | 0.35mi | 4/3.0 (-1) | 2,577 (-10%) | 2mo | $474,990 | $184 | 61 |
| 102 Fortuna Ct | 0.45mi | 4/3.0 (-1) | 2,561 (-10%) | 1mo | $475,000 | $185 | 56 |
| 1012 Carillon Ct | 0.45mi | 4/3.0 (-1) | 2,529 (-11%) | 1mo | $589,900 | $233 | 54 |
| 333 Blue Summit Bnd | 0.46mi | 4/3.0 (-1) | 2,426 (-15%) | 2mo | $549,900 | $227 | 47 |
Match score weights: distance 35% · size 25% · config 20% · recency 20%. Top-matched comps best support the ARV.
Projected returns pro-forma
-3.0% appreciation · 0.0% rent growth · sell at horizon
- IRR
- -26.6%
- Equity multiple
- 0.13×
- Total profit
- $-97,852
- Equity at exit
- $59,640
- IRR
- -38.8%
- Equity multiple
- -0.35×
- Total profit
- $-150,748
- Equity at exit
- $34,584
Cash invested: $111,997 (down + closing). Projections, not guarantees.
Landlord ↔ Tenant lean methodology
- Overall (STATE)
- 87 Strongly Landlord-Friendly
- State Texas
- 87 Strongly Landlord-Friendly · R+5
- County
- — inherits STATE
- City
- — inherits STATE
ZIP-level market 78642
- Home prices YoY
- -32.4%
- Rents YoY
- -1.9%
- Active inventory
- 1509
- Price-to-rent
- 10.9×
Monthly cashflow live
- Estimated rent
- $3,072 high interval (Pro) →
- Mortgage (P&I)
- −$2,098
- Tax est. 1.5%
- −$500 /mo · $6,000/yr
- Insurance
- −$167
- HOA
- −$41
- Vacancy / Maint / Mgmt
- −$645
- Net cashflow
- $-378
Break-even live
Sensitivity live
| Price | -10% $-102 | -5% $-240 | +0% $-378 | +5% $-517 | +10% $-655 |
|---|---|---|---|---|---|
| Rent | -10% $-621 | -5% $-500 | +0% $-378 | +5% $-257 | +10% $-136 |
| Rate | -1.0pp $-177 | -0.5pp $-277 | base $-378 | +0.5pp $-482 | +1.0pp $-588 |
UW: 25.0% down · 7.5% · 30yr · 1.5% tax · 5.0% vac · 8.0% maint · 8.0% mgmt
Financing live
Cash to close
- Down payment
- $99,998
- Closing costs
- $12,000
- Reserves months
- —
- Total cash needed
- —
Loan-product check · same deal, 3 products live
Conventional
25% down · 7.5% · 30yr
- Down + closing
- —
- Monthly P&I
- —
- Monthly cashflow
- —
- DSCR
- —
- Eligible?
- —
Personal DTI + credit; lowest rate.
DSCR
20% down · 8.5% · 30yr
- Down + closing
- —
- Monthly P&I
- —
- Monthly cashflow
- —
- DSCR
- —
- Eligible?
- —
No personal income docs; deal must DSCR.
Hard money
10% down · 12.0% · 12mo
- Down + closing
- —
- Monthly P&I
- —
- Monthly cashflow
- —
- DSCR
- —
- Eligible?
- —
Short-term bridge; refi at stabilization.
Rent comps 9 comps
| Address | Beds | Baths | Sqft | Rent | $/sqft | DOM | Units | Dist |
|---|---|---|---|---|---|---|---|---|
| 296 Redonda Dr Liberty Hill, TX | 4.0 | 3.5 | 2988 | $2,905 | $0.97 | 45d | 1 | 0.62mi |
| 312 Palatino Bnd Liberty Hill, TX | 4.0 | 5.0 | 3650 | $3,590 | $0.98 | 5d | 1 | 0.72mi |
| 253 Rosetta Loop Liberty Hill, TX | 5.0 | 5.0 | 3986 | $3,950 | $0.99 | 45d | 1 | 0.78mi |
| 183 Alicante Ln Liberty Hill, TX | 4.0 | 3.0 | 2400 | $2,575 | $1.07 | 45d | 1 | 0.97mi |
| 128 Free Stone Dr Georgetown, TX | 4.0 | 3.0 | 2053 | $2,195 | $1.07 | 45d | 1 | 0.97mi |
| 209 Winding Hollow Ln Georgetown, TX | 4.0 | 3.0 | 2342 | $2,495 | $1.07 | 45d | 1 | 1.10mi |
| 205 Riverhill Cv Georgetown, TX | 4.0 | 3.0 | 2095 | $2,075 | $0.99 | 26d | 1 | 1.14mi |
| 105 Tucana St Georgetown, TX | 4.0 | 2.5 | 2120 | $2,100 | $0.99 | 26d | 1 | 1.27mi |
| 120 Serpens St Georgetown, TX | 4.0 | 2.5 | 2403 | $2,299 | $0.96 | 45d | 1 | 1.27mi |
HOA detail
- Monthly dues
- $41 · $492/yr
Listing history 15 events
-
2026-06-21days on market $399,990 Active 45 DOM
-
2026-06-18days on market $399,990 Active 42 DOM
-
2026-06-17days on market $399,990 Active 41 DOM
-
2026-06-16days on market $399,990 Active 40 DOM
-
2026-06-15days on market $399,990 Active 39 DOM
-
2026-06-13days on market $399,990 Active 37 DOM
-
2026-06-09days on market $399,990 Active 33 DOM
-
2026-06-08days on market $399,990 Active 32 DOM
-
2026-06-07days on market $399,990 Active 31 DOM
-
2026-06-05days on market $399,990 Active 28 DOM
-
2026-06-03days on market $399,990 Active 27 DOM
-
2026-06-02pricedays on market $399,990 Active 26 DOM
-
2026-06-01days on market $424,990 Active 25 DOM
-
2026-05-31days on market $424,990 Active 24 DOM
-
2026-05-07$424,990 Active 858-char remark
ⓘ Source: listings_history table (triggers on properties + properties_extension) + one-shot
backfill from property_details.listing_events for pre-trigger history.
Nearby sold comps map
Loading sold comps map…
Walkable amenities ~0.75 mi
Loading nearby amenities…
Taxation est. · year 1
- Rental income
- $36,862
- − Mortgage interest
- −$22,406
- − Property taxes
- −$6,000
- − Insurance
- −$2,000
- − Repairs & maintenance
- −$2,949
- − Management
- −$2,949
- − HOA
- −$492
- − Depreciation
- −$11,636
- Taxable loss
- −$11,569
- Est. tax savings @ 24.0%
- +$2,777
- After-tax cash flow
- $-1,765/yr
For passive investors: Depreciation is non-cash, so a rental often shows a tax loss while cash-flowing — sheltering income. Rental losses are passive: they offset passive income freely, and up to $25,000/yr can offset ordinary (W-2) income if you actively participate and your MAGI is under $100k (phasing out to $0 by $150k); unused losses carry forward. On sale, claimed depreciation is recaptured at up to 25%, and gains may owe capital-gains tax (a 1031 exchange can defer both). Figures are a year-1 estimate at your 24.0% rate — not tax advice; consult a CPA.
Schools (NCES district)
- District
- Liberty Hill ISD
- NCES district ID
- 4827420
- Math proficiency
- 43% ▼ -20.00%
- Reading proficiency
- 52% ▼ -11.00%
- Median HH income
- $81,084
- Composite
- 43.65/100
- National rank
- #2965
- State rank
- #160 of 826 in TX
Livability — Santa Rita Ranch
No livability data for this city. (Only ~50 U.S. cities are tracked.)
Census & demographics
- Census place
- Santa Rita Ranch, TX
- County
- Williamson County · 680,029 people
- Metro
- Austin-Round Rock-Georgetown, TX
- Population (ZIP)
- 26,434
- Household income
- $132,958
- Rent vs Own
- Severe rent burden
- 220.0
Population outlook (Williamson County) Hauer SSP2
- Today (2025)
- 699,027 people
- By 2030
- 795,537 · +13.8%
- By 2040
- 990,683 · +41.7%
- By 2050
- 1,184,292 · +69.4%
- By 2075
- 1,623,825 · +132.3%
- By 2100
- 1,924,153 · +175.3%
Race, ethnicity, and origin ACS 2023
- Neighborhood character
- Predominantly White (65%)
- Race & ethnicity
- White 65% Hispanic / Latino 27% Two or more races 14% Asian 2% Black 2%
- Hispanic origin (detail)
- Mexican 25% Puerto Rican 1%
- Common ancestry
- Slovak 3% Romanian 3% Lithuanian 3%
- Foreign-born
- 9% · Canada
- Languages at home
- 81% English-only · Spanish 15% Other Asian/Pacific 1% Tagalog/Filipino 1%
Political lean MEDSL · Williamson
- 2024 margin
- Toss-up / Even · D 48.0% · R 50.4% · Other 1.6%
- 2008→2024 swing
- +10.6pp toward D · 2008: -13.0pp · 2024: -2.5pp
- All cycles
- 2024: R+2.5 2020: D+1.4 2016: R+9.9 2012: R+21.5 2008: R+13.0
Not yet ingested
- Civics
- —
Market trends
- HPI YoY
- ▼ -109.62%
- Current HPI
- 228.5772
- Rent YoY
- ▼ -1.89%
- Metro
- Austin-Round Rock-Georgetown, TX
- State GDP YoY
- ▲ 3.95%
- F500 in state
- 110
Industry mix (Fortune 500 HQ in TX)
| Industry | F500 HQs | Revenue |
|---|---|---|
| Energy | 16 | $1,198B |
|
||
| Technology | 5 | $198B |
|
||
| Engineering / Construction | 4 | $72B |
|
||
| Energy Services | 3 | $60B |
|
||
| Utilities | 3 | $41B |
|
||
| Healthcare | 2 | $330B |
|
||
Price history
-8.2% since first listed7 events — show timeline
- 2026-06-11 Price Changed $389,990 Zillow
- 2026-06-11 Price Changed $399,990 Zillow
- 2026-06-10 Price Changed $389,990 Zillow
- 2026-06-02 Price Changed $399,990 Unlock MLS
- 2026-05-28 Price Changed $399,990 Zillow
- 2026-05-27 Listed $424,990 Zillow
- 2026-05-07 Listed $424,990 Unlock MLS
Cash-flow waterfall
monthlySold comps — $/sqft
last 12 mo · ≤1 miLoading sold comps…