 Fourplex
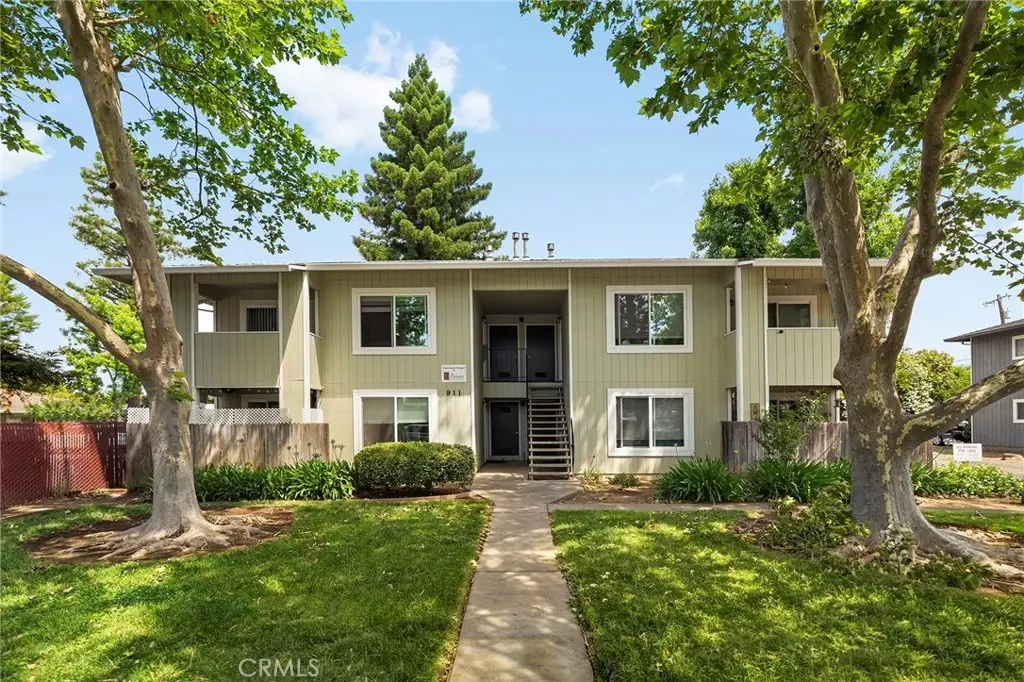
911 Christi · Chico, CA
Flood risk 1/10 · Minimal
- FEMA flood zone
- X (shaded)
- Chance of flooding over 30 yrs
- 0.0%
- Est. flood insurance / yr
- $507 – $1,088
Fire risk 7/10 · Major
- Est. fire insurance / yr
- $659 – $1,223
Heat risk 8/10 · Major
- Hot days now (above 105°F)
- 5 days/yr
- Hot days in 30 yrs
- 12 days/yr
Wind risk 1/10 · Minimal
- Chance of severe wind over 30 yrs
- —
Air-quality risk 10/10 · Severe
- Unhealthy air days now
- 37 days/yr
- Unhealthy air days in 30 yrs
- 39 days/yr
Risk factors via First Street. Map © Google.
Why this score? — see what drove the D grade
The composite is a weighted blend of 9 inputs, each scored 0–100. Each bar is that input's sub-score; the figure is the points it added to the 100-point composite (weight × sub-score).
- Cash flow +14.2/30.0
- ARV discount +7.5/15.0
- Schools +4.6/10.0
- DSCR +4.3/10.0
- Livability +3.6/5.0
- 1% rule +3.1/10.0
- Rent growth +2.9/5.0
- Condition / age +2.5/5.0
- Appreciation +0.0/10.0
$725,000
🖨 Deal sheet (PDF) 📄 Offer letter ✓ Due diligence
Multi-family units
County records classify this as Multi-Family (2-4 Unit). Listing-text estimate: 4 units. confirmed
Listing remarks MLS
Property has good rental history; three units now rented at $650 ea. and 4th has a long term renter at $600. Each unit is 2Br, 1Ba. Parking is in the rear of building. Tax records do not show year built.
Key facts
- Updated units
- Exterior paint
- Dual-pane windows
Tags
Property features AI
Finance
- Other: Units include multiple separately metered utilities; Unit example: a 2-bedroom, 1-bath unfurnished unit currently shows $4,860 rent (one of four units)
- Financial info: Total building area reported as 3,420; Total of 4 units; Gross scheduled income: $58,320; Gross income: $53,955.80; Net operating income: $35,439; Operating expenses: $18,516; Expense details include insurance, maintenance, gardener, trash, pest control, and water/sewer
Exterior
- Utilities: Public sewer; District/Public water; One separate water meter; Four separate gas meters; Four separate electric meters
- Home design: Attached property; Two stories; Entry level: 1
- Construction: Single building containing all units; Built year sourced from assessor
- Exterior features: No pool; Level lot with street access; Street lighting and storm drains in the community
Interior
- Bedrooms: Some units include 2 bedrooms
- Bathrooms: Some units include 1 full bathroom
- Heating & cooling: Central furnace heating
- Interior features: Two-level layout; Entry on the first level
- Laundry & utility: No laundry hookups listed
Neighborhood map
What this means for you Summary
Snapshot
- This is a 4 × 2-bed/1.0-bath units multifamily listed at $725k.
Deal economics
- At list price, monthly cash flow is $113 ($1k/yr) — positive. Per door: $28/mo.
- The deal already cash-flows at list — no discount required.
- To meet the 1% rule (rent ≥ 1% of price), the offer needs to be $587k (19.0% below list).
- Recommended offer: $587k (19.0% below list) — sets the bar for 1% rule.
- Cap rate 6.5% vs local median 2.6% in Chico — top-decile yield for the area; either an underpriced asset or a hidden risk that comps aren't pricing in. Stress-test before assuming the spread holds.
Location & tenants
- Location reads 72/100 on livability (#195 in CA) — a middle-class / working-renter tenant base. Strengths: amenities A+, commute A+, health & safety A-; Watch: employment C-, crime F, cost of living F.
- Chico Unified (urban): math 40% / reading 70% proficiency, ranked #117 of 517 in CA (top 23%) — acceptable for families but not a draw, mixed tenant base, ~2y average lease.
- Zoned schools: Rosedale Elementary (543 students, 53% FRL); Bidwell Junior High (math 24% / reading 24%, grade F, #277 of 498 statewide, top 73%, 990 students, 57% FRL); Pleasant Valley High (math 54% / reading 80%, grade B, #139 of 1,170 statewide, top 13%, 1,840 students, 46% FRL).
- Market conditions: Rents rising (+1.7%/yr); 152 active listings in the ZIP; solid renter incomes; 946 units permitted in Butte County in 2024 (254 in 5+ unit buildings).
- At $5,873/mo this rent would consume 76% of the median local household income ($93k/yr) (locally 1230% of renters already pay >50% of income on rent) — very limited rent-growth headroom before tenants either downsize or default.
Forward outlook
- Local home prices are declining (-3.0%/yr); year-one equity from $5k of loan paydown is wiped out by about $22k of value loss. Plan a longer hold.
- Butte County population projected at +10% by 2050 — modest demand growth; plan on rents tracking national, not racing it.
Negotiation context
- It's been on market 19 days — a 2% lower offer ($714k) is reasonable based on typical stale-listing flexibility.
- 2 sale attempts since 15y ago with the ask held roughly flat each time — persistent listings suggest the price (not the market) is what's stuck; bring a comps-based counter.
- Current owner paid $340k; list at $725k implies a 113% gain — meaningful room to come down on a strong offer.
Risks & watch-outs
- Climate carrying-cost: major wildfire risk; extreme-heat days projected 5→12/yr by 2055 (HVAC capex compounding) — expect insurance premiums to compound above CPI over the hold.
Questions for the listing agent
- Can we see the unit-by-unit rent roll, current vacancy, and any below-market leases? What's the average tenancy length?
- What capital expenditures (roof, boiler, parking lot, exteriors) have been made in the last 5 years, and what's planned in the next 2?
- Is there a deadline driving the sale (1031 exchange, divorce, estate, relocation)? That informs how much negotiation room exists.
- Schools are B-rated — typically a magnet for longer-tenancy family renters. What's the average tenant stay here, and is there a school-zone premium baked into asking?
- Crime grade is F in this area — have there been break-ins, vandalism, or insurance claims at this property in the last 3 years? What carrier currently insures it and at what premium?
- The area grade is low — what's the realistic commute time and amenity access for the typical tenant pool here? Any planned neighborhood developments (good or bad) we should know about?
- What's the average days-on-market for RENTAL listings here right now (not sales)? A rising rental-DOM trend means longer vacancies and softer asking-rent achievability than the comps imply.
- What's the recent tenant-quality profile in this submarket — average credit score on applications, eviction rate, late-payment / NSF rate, and stable-employment percentage? A property-management company in the area should have these aggregated.
- How much new apartment / multifamily construction is in the pipeline within 1–3 miles? Heavy new supply (>2% of stock underway) typically softens rents 12–24 months out; light construction supports rent growth.
Investment metrics
- 1% rule
- 0.81% ✗
- Cap rate
- 6.48%
- Cash-on-cash
- 0.67%
- DSCR
- 1.03
- GRM
- 10.3
CMA / ARV
No comps found within radius.
Projected returns pro-forma
-3.0% appreciation · 1.7% rent growth · sell at horizon
- IRR
- -16.6%
- Equity multiple
- 0.42×
- Total profit
- $-118,078
- Equity at exit
- $108,100
- IRR
- -10.7%
- Equity multiple
- 0.39×
- Total profit
- $-124,719
- Equity at exit
- $62,685
Cash invested: $203,000 (down + closing). Projections, not guarantees.
Landlord ↔ Tenant lean methodology
- Overall (STATE)
- 18 Strongly Tenant-Friendly
- State California
- 18 Strongly Tenant-Friendly · D+13
- County
- — inherits STATE
- City
- — inherits STATE
ZIP-level market 95973
- Rents YoY
- 1.7%
- Active inventory
- 152
- Price-to-rent
- 41.2×
Monthly cashflow live
- Estimated rent
- $5,873 high interval (Pro) →
- Mortgage (P&I)
- −$3,802
- Tax from tax record
- −$423 /mo · $5,071/yr
- Insurance
- −$302
- HOA
- −$0
- Vacancy / Maint / Mgmt
- −$1,233
- Net cashflow
- $113
Break-even live
Sensitivity live
| Price | -10% $523 | -5% $318 | +0% $113 | +5% $-92 | +10% $-297 |
|---|---|---|---|---|---|
| Rent | -10% $-351 | -5% $-119 | +0% $113 | +5% $345 | +10% $577 |
| Rate | -1.0pp $478 | -0.5pp $297 | base $113 | +0.5pp $-75 | +1.0pp $-266 |
4-unit breakdown (identical units grouped — click to expand)
| Units | Beds | Baths | Est. rent |
|---|---|---|---|
| 4× units | 2 | 1 | $5,872 |
| #1 | 2 | 1 | $1,468 |
| #2 | 2 | 1 | $1,468 |
| #3 | 2 | 1 | $1,468 |
| #4 | 2 | 1 | $1,468 |
| Total (4 units) | $5,873 | ||
UW: 25.0% down · 7.5% · 30yr · 1.5% tax · 5.0% vac · 8.0% maint · 8.0% mgmt
Financing live
Cash to close
- Down payment
- $181,250
- Closing costs
- $21,750
- Reserves months
- —
- Total cash needed
- —
Loan-product check · same deal, 3 products live
Conventional
25% down · 7.5% · 30yr
- Down + closing
- —
- Monthly P&I
- —
- Monthly cashflow
- —
- DSCR
- —
- Eligible?
- —
Personal DTI + credit; lowest rate.
DSCR
20% down · 8.5% · 30yr
- Down + closing
- —
- Monthly P&I
- —
- Monthly cashflow
- —
- DSCR
- —
- Eligible?
- —
No personal income docs; deal must DSCR.
Hard money
10% down · 12.0% · 12mo
- Down + closing
- —
- Monthly P&I
- —
- Monthly cashflow
- —
- DSCR
- —
- Eligible?
- —
Short-term bridge; refi at stabilization.
Listing history 14 events
-
2026-06-21days on market $725,000 Active 19 DOM
-
2026-06-19days on market $725,000 Active 17 DOM
-
2026-06-18days on market $725,000 Active 16 DOM
-
2026-06-17days on market $725,000 Active 15 DOM
-
2026-06-16days on market $725,000 Active 14 DOM
-
2026-06-15days on market $725,000 Active 13 DOM
-
2026-06-14days on market $725,000 Active 11 DOM
-
2026-06-13days on market $725,000 Active 10 DOM
-
2026-06-10days on market $725,000 Active 8 DOM
-
2026-06-08days on market $725,000 Active 6 DOM
-
2026-06-07days on market $725,000 Active 5 DOM
-
2026-06-05days on market $725,000 Active 2 DOM
-
2026-06-03remarks 674-char remark
-
2026-06-03$725,000 Active 1 DOM
ⓘ Source: listings_history table (triggers on properties + properties_extension) + one-shot
backfill from property_details.listing_events for pre-trigger history.
Tax reassessment forecast CA · Resets to sale price
- Current annual tax
- $5,071 · $423/mo
- Projected year-2 tax
- $5,510 · $459/mo
- Expected delta
- +$439/yr (+$37/mo · 8.6%)
ⓘ Screening estimate from a state-policy table — verify with the county assessor before closing.
Climate risk First Street
- Flood 1/10 Low FEMA zone X (shaded) · 0% chance over 30 yrs
- Wildfire 7/10 Severe
- Heat 8/10 Severe 5 d/yr ≥105°F today · 12 d/yr by 30 yrs out
- Wind 1/10 Low
- Air quality 10/10 Extreme 37 unhealthy d/yr today · 39 by 30 yrs out
Nearby sold comps map
Loading sold comps map…
Walkable amenities ~0.75 mi
Loading nearby amenities…
Taxation est. · year 1
- Rental income
- $70,476
- − Mortgage interest
- −$40,611
- − Property taxes
- −$5,071
- − Insurance
- −$3,625
- − Repairs & maintenance
- −$5,638
- − Management
- −$5,638
- − Depreciation
- −$21,091
- Taxable loss
- −$11,199
- Est. tax savings @ 24.0%
- +$2,688
- After-tax cash flow
- $4,044/yr
For passive investors: Depreciation is non-cash, so a rental often shows a tax loss while cash-flowing — sheltering income. Rental losses are passive: they offset passive income freely, and up to $25,000/yr can offset ordinary (W-2) income if you actively participate and your MAGI is under $100k (phasing out to $0 by $150k); unused losses carry forward. On sale, claimed depreciation is recaptured at up to 25%, and gains may owe capital-gains tax (a 1031 exchange can defer both). Figures are a year-1 estimate at your 24.0% rate — not tax advice; consult a CPA.
Schools (NCES district)
- District
- Chico Unified
- NCES district ID
- 0608370
- Math proficiency
- 40% ▼ -2.00%
- Reading proficiency
- 70% ▲ 14.00%
- Median HH income
- $46,223
- Composite
- 46.45/100
- National rank
- #2443
- State rank
- #117 of 517 in CA
Livability — Chico
- Score
- 72/100
- State rank
- #195
- US rank
- #6332
Category grades
Schools grade is shown separately in the Schools card above.
Census & demographics
- Census place
- Chico, CA
- County
- Butte County · 175,030 people
- City population
- 117,007
- Metro
- Chico, CA
- Population (ZIP)
- 39,031
- Household income
- $92,813
- Rent vs Own
- Severe rent burden
- 1230.0
Population outlook (Butte County) Hauer SSP2
- Today (2025)
- 237,527 people
- By 2030
- 243,804 · +2.6%
- By 2040
- 253,899 · +6.9%
- By 2050
- 262,561 · +10.5%
- By 2075
- 283,709 · +19.4%
- By 2100
- 282,689 · +19.0%
Race, ethnicity, and origin ACS 2023
- Neighborhood character
- Predominantly White (71%)
- Race & ethnicity
- White 71% Hispanic / Latino 19% Two or more races 10% Asian 5% Native American 1%
- Hispanic origin (detail)
- Mexican 15%
- Common ancestry
- Slovak 4% Italian 4% Russian 3%
- Foreign-born
- 8% · Canada, China
- Languages at home
- 84% English-only · Spanish 11% Other Asian/Pacific 2% Chinese 1%
Political lean MEDSL · Butte
- 2024 margin
- Toss-up / Even · D 46.8% · R 49.9% · Other 3.3%
- 2008→2024 swing
- -5.5pp toward R · 2008: 2.4pp · 2024: -3.1pp
- All cycles
- 2024: R+3.1 2020: D+1.7 2016: R+4.0 2012: R+3.9 2008: D+2.4
Not yet ingested
- Civics
- —
Market trends
- HPI YoY
- ▼ -182.94%
- Current HPI
- 259.9774
- Rent YoY
- ▲ 1.70%
- Metro
- Chico, CA
- State GDP YoY
- ▲ 3.21%
- F500 in state
- 116
Industry mix (Fortune 500 HQ in CA)
| Industry | F500 HQs | Revenue |
|---|---|---|
| Technology | 27 | $1,492B |
|
||
| Financial Services | 3 | $174B |
|
||
| Retail | 3 | $44B |
|
||
| Insurance | 3 | $26B |
|
||
| Media / Entertainment | 2 | $115B |
|
||
| Pharmaceuticals / Biotech | 2 | $62B |
|
||
Price history
+101.9% since first listed10 events — show timeline
- 2026-06-02 Listed $725,000 CRMLS
- 2023-07-18 Rental Removed — APPFOLIO
- 2011-05-27 Sold (Public Records) $340,000 Public Records
- 2011-05-27 Sold (MLS) $340,000 CRMLS
- 2011-05-27 Sold (MLS) $340,000 CRMLS
- 2011-05-27 Sold (MLS) $340,000 CRMLS
- 2011-05-27 Sold (MLS) $340,000 CRMLS
- 2011-05-27 Sold (MLS) $340,000 CRMLS
- 2011-05-27 Sold (MLS) $340,000 CRMLS
- 2011-02-08 Listed $359,000 CRMLS
Property tax history
+2.6%/yrLatest (2025): $5,071 · +6.6% YoY. Source: county tax records.
Cash-flow waterfall
monthlySold comps — $/sqft
last 12 mo · ≤1 miLoading sold comps…