 🌊 Lakefront
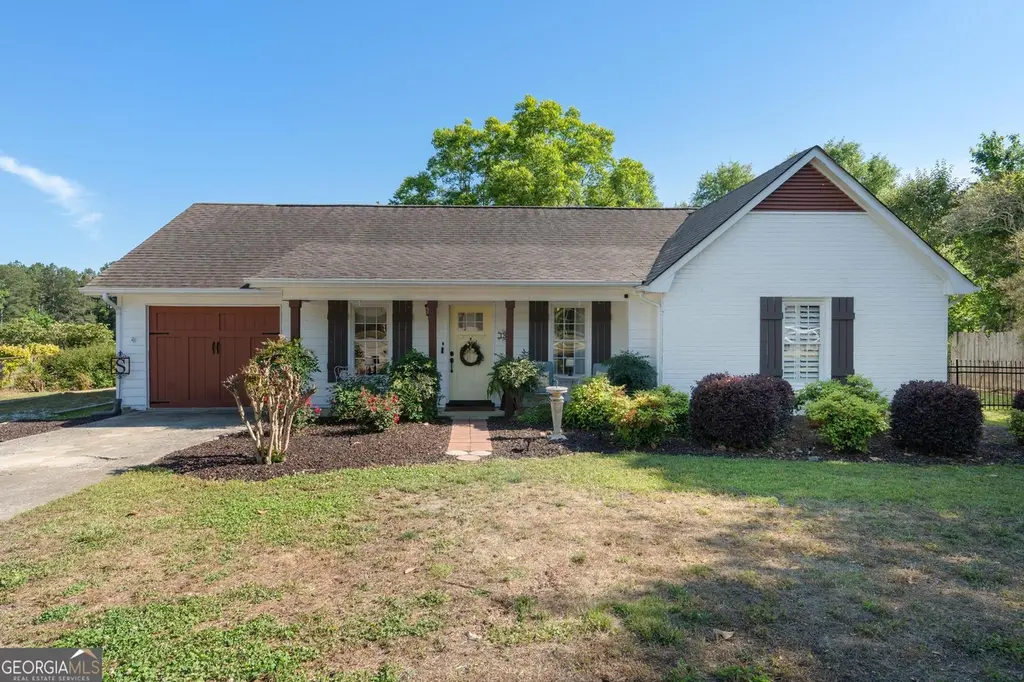
185 N Hampton Dr · Fayetteville, GA
Flood risk 1/10 · Minimal
- FEMA flood zone
- X (unshaded)
- Chance of flooding over 30 yrs
- 0.0%
- Est. flood insurance / yr
- $507 – $1,088
Fire risk 2/10 · Minimal
- Est. fire insurance / yr
- $963 – $1,789
Heat risk 6/10 · Moderate
- Hot days now (above 106°F)
- 7 days/yr
- Hot days in 30 yrs
- 18 days/yr
Wind risk 6/10 · Moderate
- Chance of severe wind over 30 yrs
- 27.0%
Air-quality risk 4/10 · Minor
- Unhealthy air days now
- 3 days/yr
- Unhealthy air days in 30 yrs
- 5 days/yr
Risk factors via First Street. Map © Google.
Why this score? — see what drove the C grade
The composite is a weighted blend of 9 inputs, each scored 0–100. Each bar is that input's sub-score; the figure is the points it added to the 100-point composite (weight × sub-score).
- Cash flow +18.5/30.0
- ARV discount +15.0/15.0
- DSCR +5.8/10.0
- Schools +5.1/10.0
- 1% rule +3.7/10.0
- Livability +3.6/5.0
- Rent growth +3.3/5.0
- Condition / age +2.5/5.0
- Appreciation +0.0/10.0
$309,900
🖨 Deal sheet (PDF) 📄 Offer letter ✓ Due diligence
Listing remarks
* * * Be sure to ask about our LENDER-PAID 1-0 BUYDOWN option! Enjoy an INTEREST RATE THAT IS 1% LOWER DURING YOUR FIRST YEAR. * * * Back on the market due to no fault of the seller and the home! The move-in ready Fayetteville home with character buyers have been waiting for. With peaceful pond views, thoughtfully updated interiors, and inviting outdoor spaces, 185 N Hampton Drive offers a lifestyle that feels warm, functional, and effortlessly welcoming. A charming FOYER ENTRANCE opens into a bright OPEN CONCEPT living and dining area, creating a natural flow that feels both spacious and comfortable. The living room FIREPLACE adds warmth and charm, while the beautifully updated kitche
Key facts
- Open concept living
- Pond views
- Foyer entrance
Tags
Property features AI
Finance
- Other: Lot is level, approximately 0.35 acre; Subdivision: Nantucket; Listing accepts Cash, Conventional, FHA and VA financing
- HOA & community: No homeowners association
Exterior
- Parking: Open parking with guest parking and parking pad (kitchen level)
- Security: Smoke detectors
- Utilities: Public water; Public sewer (sewer connected); Natural gas available; Cable available; High-speed internet available
- Home design: Single-family house; Resale property; One story
- Construction: Built in 1984; Brick, concrete and press board construction; Composition roof; Slab foundation
- Exterior features: Pond waterfront; Water feature on the property; Deck and porch; Back yard chain link fencing; Outbuilding / shed
Interior
- Kitchen: Breakfast area; Pantry and walk-in pantry; Dishwasher; Microwave; Stainless steel appliances
- Bedrooms: 4 bedrooms on the main level
- Flooring: Vinyl flooring
- Bathrooms: 2 full bathrooms (main level)
- Heating & cooling: Central heating (natural gas); Central air conditioning
- Interior features: Walk-in closets; Family room with a gas log fireplace; Dining room and living room combined; No basement; One level
- Laundry & utility: Shared/common area laundry
Neighborhood map
What this means for you Summary
Snapshot
- This is a 4-bed/3.0-bath single-family listed at $310k.
Deal economics
- At list price, monthly cash flow is $296 ($4k/yr) — positive.
- The deal already cash-flows at list — no discount required.
- To meet the 1% rule (rent ≥ 1% of price), the offer needs to be $270k (12.9% below list).
- Recommended offer: $270k (12.9% below list) — sets the bar for 1% rule.
- Cap rate 7.4% vs local median 4.3% in Fayetteville — top-decile yield for the area; either an underpriced asset or a hidden risk that comps aren't pricing in. Stress-test before assuming the spread holds.
Location & tenants
- Location reads 71/100 on livability (#86 in GA) — a middle-class / working-renter tenant base. Strengths: housing A+, health & safety B+, employment B; Watch: amenities F, commute F.
- Fayette County (suburban): math 52% / reading 60% proficiency, ranked #7 of 174 in GA (top 4%) — acceptable for families but not a draw, mixed tenant base, ~2y average lease.
- Zoned schools: Spring Hill Elementary School (math 39% / reading 42%, grade F, #419 of 1,228 statewide, top 35%, 655 students, 63% FRL); Bennett'S Mill Middle School (math 24% / reading 51%, grade F, #162 of 470 statewide, top 35%, 891 students, 53% FRL); Fayette County High School (math 15% / reading 42%, grade F, #149 of 424 statewide, top 35%, 1,368 students, 46% FRL) — zoned schools average 54% FRL vs 21% district-wide (33 pts higher); higher-poverty schools than district average — tighter screening recommended.
- Zoned-school proficiency averages 36% at this address vs 56% district-wide (-20 pts) — the specific schools serving this property underperform the Fayette County average; the district grade overstates school quality for this exact location.
- Market conditions: Rents rising (+3.2%/yr); 311 active listings in the ZIP; 5 comparable units currently listed for rent nearby; rentals lingering (median 45d on market — plan ~5-8 weeks vacancy on turnover, expect pricing pressure); 60% of comp listings sitting > 30 days — soft ceiling on asking rent; high-income renter base; 323 units permitted in Fayette County in 2024 (0 in 5+ unit buildings).
Forward outlook
- Local home prices are declining (-3.0%/yr); year-one equity from $2k of loan paydown is wiped out by about $9k of value loss. Plan a longer hold.
- Fayette County population projected at +13% by 2050 — modest demand growth; plan on rents tracking national, not racing it.
Negotiation context
- Only 11 days on market — expect competitive offers; lowballing is unlikely to land.
- 2 sale attempts with the ask held roughly flat each time — persistent listings suggest the price (not the market) is what's stuck; bring a comps-based counter.
- Current owner paid $95k; list at $310k implies a 227% gain — meaningful room to come down on a strong offer.
Risks & watch-outs
- Climate carrying-cost: major wind risk, 27% chance of damaging wind over 30y; extreme-heat days projected 7→18/yr by 2055 (HVAC capex compounding) — expect insurance premiums to compound above CPI over the hold.
Questions for the listing agent
- Is there a deadline driving the sale (1031 exchange, divorce, estate, relocation)? That informs how much negotiation room exists.
- Schools are B-rated — typically a magnet for longer-tenancy family renters. What's the average tenant stay here, and is there a school-zone premium baked into asking?
- This sits on a lake — are riparian / water-frontage rights deeded with the parcel? Any dock permits, shoreline easements, or HOA water-use restrictions?
- What's the documented flood / surge / shoreline-erosion history here (FEMA AND non-FEMA — e.g., storm surge, creek backup, septic-field saturation)?
- Any water-quality or seasonal algae-bloom issues that affect tenant satisfaction or short-term-rental demand?
- What's the average days-on-market for RENTAL listings here right now (not sales)? A rising rental-DOM trend means longer vacancies and softer asking-rent achievability than the comps imply.
- What's the recent tenant-quality profile in this submarket — average credit score on applications, eviction rate, late-payment / NSF rate, and stable-employment percentage? A property-management company in the area should have these aggregated.
- How much new for-sale + rental construction is in the pipeline within 1–3 miles? Heavy new supply typically softens prices + rents 12–24 months out; constrained supply supports both.
Investment metrics
- 1% rule
- 0.87% ✗
- Cap rate
- 7.44%
- Cash-on-cash
- 4.09%
- DSCR
- 1.18
- GRM
- 9.6
CMA / ARV
- ARV (on-the-fly)
- $374,026
- Comps found
- 10
Show comp detail 10 sales within ~0.75 mi
| Address | Dist | Beds/Ba | Sqft | Sold | Price | $/sf | Match |
|---|---|---|---|---|---|---|---|
| 130 Lake Dr | 0.29mi | 3/2.0 (-1) | 1,281 (+3%) | 21mo | $285,000 | $222 | 56 |
| 100 Ficus Ln | 0.17mi | 3/2.0 (-1) | 1,386 (+11%) | 15mo | $305,000 | $220 | 52 |
| 200 Booker Ave | 0.72mi | 3/2.0 (-1) | 1,276 (+2%) | 5mo | $213,000 | $167 | 49 |
| 310 Dempsey Dr Lot 25 | 0.74mi | 3/3.0 (-1) | 1,328 (+6%) | 2mo | $342,615 | $258 | 48 |
| 300 Dempsey Dr Lot 24 | 0.74mi | 3/3.0 (-1) | 1,328 (+6%) | 2mo | $339,537 | $256 | 48 |
| 130 Emily Park | 0.40mi | 3/2.0 (-1) | 1,432 (+15%) | 1mo | $300,000 | $209 | 47 |
| 160 Eastfield Ct | 0.71mi | 3/2.0 (-1) | 1,369 (+10%) | 4mo | $319,000 | $233 | 38 |
| 140 Cloverwood Dr | 0.69mi | 3/2.0 (-1) | 1,315 (+5%) | 15mo | $290,000 | $221 | 37 |
| 110 Cloverwood Dr | 0.72mi | 3/2.0 (-1) | 1,338 (+7%) | 13mo | $299,900 | $224 | 34 |
| 185 Cloverwood Dr | 0.57mi | 3/2.0 (-1) | 1,435 (+15%) | 17mo | $289,900 | $202 | 25 |
Match score weights: distance 35% · size 25% · config 20% · recency 20%. Top-matched comps best support the ARV.
Projected returns pro-forma
-3.0% appreciation · 3.22% rent growth · sell at horizon
- IRR
- -9.7%
- Equity multiple
- 0.64×
- Total profit
- $-30,941
- Equity at exit
- $46,207
- IRR
- -0.1%
- Equity multiple
- 0.99×
- Total profit
- $-832
- Equity at exit
- $26,794
Cash invested: $86,772 (down + closing). Projections, not guarantees.
Landlord ↔ Tenant lean methodology
- Overall (STATE)
- 90 Strongly Landlord-Friendly
- State Georgia
- 90 Strongly Landlord-Friendly · R+3
- County
- — inherits STATE
- City
- — inherits STATE
ZIP-level market 30215
- Rents YoY
- 3.2%
- Active inventory
- 311
- Price-to-rent
- 9.6×
Monthly cashflow live
- Estimated rent
- $2,700 high interval (Pro) →
- Mortgage (P&I)
- −$1,625
- Tax from tax record
- −$83 /mo · $995/yr
- Insurance
- −$129
- HOA
- −$0
- Vacancy / Maint / Mgmt
- −$567
- Net cashflow
- $296
Break-even live
Sensitivity live
| Price | -10% $471 | -5% $383 | +0% $296 | +5% $208 | +10% $120 |
|---|---|---|---|---|---|
| Rent | -10% $82 | -5% $189 | +0% $296 | +5% $402 | +10% $509 |
| Rate | -1.0pp $452 | -0.5pp $374 | base $296 | +0.5pp $215 | +1.0pp $134 |
UW: 25.0% down · 7.5% · 30yr · 1.5% tax · 5.0% vac · 8.0% maint · 8.0% mgmt
Financing live
Cash to close
- Down payment
- $77,475
- Closing costs
- $9,297
- Reserves months
- —
- Total cash needed
- —
Loan-product check · same deal, 3 products live
Conventional
25% down · 7.5% · 30yr
- Down + closing
- —
- Monthly P&I
- —
- Monthly cashflow
- —
- DSCR
- —
- Eligible?
- —
Personal DTI + credit; lowest rate.
DSCR
20% down · 8.5% · 30yr
- Down + closing
- —
- Monthly P&I
- —
- Monthly cashflow
- —
- DSCR
- —
- Eligible?
- —
No personal income docs; deal must DSCR.
Hard money
10% down · 12.0% · 12mo
- Down + closing
- —
- Monthly P&I
- —
- Monthly cashflow
- —
- DSCR
- —
- Eligible?
- —
Short-term bridge; refi at stabilization.
Rent comps 5 comps
| Address | Beds | Baths | Sqft | Rent | $/sqft | DOM | Units | Dist |
|---|---|---|---|---|---|---|---|---|
| 155 N Hampton Dr Fayetteville, GA | 3.0 | 2.0 | 1398 | $2,250 | $1.61 | 45d | 1 | 0.07mi |
| 2400 Cobblestone Blvd Fayetteville, GA | 1.0–3.0 | 1.0–2.0 | 1149 | $1,905 | $1.66 | 0d | 9 | 0.46mi |
| 370 Georgia Ave Fayetteville, GA | 3.0 | 2.0 | 1334 | $3,500 | $2.62 | 45d | 1 | 1.12mi |
| 100 Knight Way Fayetteville, GA | 1.0–3.0 | 1.0–2.0 | 1035 | $1,949 | $1.88 | 45d | 1 | 1.14mi |
| 120 Kent Dr Fayetteville, GA | 3.0 | 2.0 | 1468 | $2,021 | $1.38 | 0d | 1 | 1.42mi |
Listing history 6 events
-
2026-05-19status Back On Market
-
2026-05-12status Under Contract
-
2026-04-26$309,900 New
-
1999-09-08soldstatus $94,900
-
1999-04-28soldstatus $84,000
-
1988-03-22soldstatus $55,240
ⓘ Source: listings_history table (triggers on properties + properties_extension) + one-shot
backfill from property_details.listing_events for pre-trigger history.
Tax reassessment forecast GA · Resets to sale price
- Current annual tax
- $995 · $83/mo
- Projected year-2 tax
- $2,851 · $238/mo
- Expected delta
- +$1,856/yr (+$155/mo · 186.5%)
ⓘ Screening estimate from a state-policy table — verify with the county assessor before closing.
Climate risk First Street
- Flood 1/10 Low FEMA zone X (unshaded) · 0% chance over 30 yrs
- Wildfire 2/10 Low
- Heat 6/10 Major 7 d/yr ≥106°F today · 18 d/yr by 30 yrs out
- Wind 6/10 Major 27% chance of damaging wind over 30 yrs
- Air quality 4/10 Moderate 3 unhealthy d/yr today · 5 by 30 yrs out
Nearby sold comps map
Loading sold comps map…
Walkable amenities ~0.75 mi
Loading nearby amenities…
Taxation est. · year 1
- Rental income
- $32,396
- − Mortgage interest
- −$17,359
- − Property taxes
- −$995
- − Insurance
- −$1,550
- − Repairs & maintenance
- −$2,592
- − Management
- −$2,592
- − Depreciation
- −$9,015
- Taxable loss
- −$1,706
- Est. tax savings @ 24.0%
- +$410
- After-tax cash flow
- $3,956/yr
For passive investors: Depreciation is non-cash, so a rental often shows a tax loss while cash-flowing — sheltering income. Rental losses are passive: they offset passive income freely, and up to $25,000/yr can offset ordinary (W-2) income if you actively participate and your MAGI is under $100k (phasing out to $0 by $150k); unused losses carry forward. On sale, claimed depreciation is recaptured at up to 25%, and gains may owe capital-gains tax (a 1031 exchange can defer both). Figures are a year-1 estimate at your 24.0% rate — not tax advice; consult a CPA.
Schools (NCES district)
- District
- Fayette County
- NCES district ID
- 1302130
- Math proficiency
- 52% ▼ -12.00%
- Reading proficiency
- 60% ▼ -7.00%
- Median HH income
- $80,746
- Composite
- 50.67/100
- National rank
- #1824
- State rank
- #7 of 174 in GA
Livability — Fayetteville
- Score
- 71/100
- State rank
- #86
- US rank
- #7167
Category grades
Schools grade is shown separately in the Schools card above.
Census & demographics
- Census place
- Fayetteville, GA
- County
- Fayette County · 112,821 people
- City population
- 72,287
- Metro
- Atlanta-Sandy Springs-Alpharetta, GA
- Population (ZIP)
- 40,476
- Household income
- $118,436
- Rent vs Own
- Severe rent burden
- 415.0
Population outlook (Fayette County) Hauer SSP2
- Today (2025)
- 120,914 people
- By 2030
- 125,439 · +3.7%
- By 2040
- 132,378 · +9.5%
- By 2050
- 137,123 · +13.4%
- By 2075
- 156,091 · +29.1%
- By 2100
- 163,102 · +34.9%
Race, ethnicity, and origin ACS 2023
- Neighborhood character
- Diverse neighborhood (Simpson 0.60)
- Race & ethnicity
- White 57% Black 26% Two or more races 7% Hispanic / Latino 6% Asian 3%
- Hispanic origin (detail)
- Mexican 2% Puerto Rican 1%
- Common ancestry
- Slovak 3% Italian 2% Lithuanian 2%
- Foreign-born
- 7% · Canada, China, Vietnam
- Languages at home
- 90% English-only · Spanish 5% Other Indo-European 1% German/W. Germanic 1%
Political lean MEDSL · Fayette
- 2024 margin
- Toss-up / Even · D 48.0% · R 51.1%
- 2008→2024 swing
- +27.5pp toward D · 2008: -30.7pp · 2024: -3.1pp
- All cycles
- 2024: R+3.1 2020: R+6.8 2016: R+19.5 2012: R+31.4 2008: R+30.7
Not yet ingested
- Civics
- —
Market trends
- HPI YoY
- ▼ -146.38%
- Current HPI
- 238.3395
- Rent YoY
- ▲ 3.22%
- Metro
- Atlanta-Sandy Springs-Alpharetta, GA
- State GDP YoY
- ▲ 2.66%
- F500 in state
- 28
Industry mix (Fortune 500 HQ in GA)
| Industry | F500 HQs | Revenue |
|---|---|---|
| Paper / Packaging | 2 | $29B |
|
||
| Retail | 1 | $160B |
|
||
| Transportation / Logistics | 1 | $91B |
|
||
| Airlines | 1 | $62B |
|
||
| Consumer Goods | 1 | $47B |
|
||
| Utilities | 1 | $25B |
|
||
Price history
+461.0% since first listed7 events — show timeline
- 2026-05-26 Pending — GAMLS
- 2026-05-19 Relisted — GAMLS
- 2026-05-12 Pending — GAMLS
- 2026-04-26 Listed $309,900 GAMLS
- 1999-09-08 Sold (Public Records) $94,900 Public Records
- 1999-04-28 Sold (Public Records) $84,000 Public Records
- 1988-03-22 Sold (Public Records) $55,240 Public Records
Property tax history
-6.5%/yrLatest (2014): $995 · -1.6% YoY. Source: county tax records.
Cash-flow waterfall
monthlySold comps — $/sqft
last 12 mo · ≤1 miLoading sold comps…