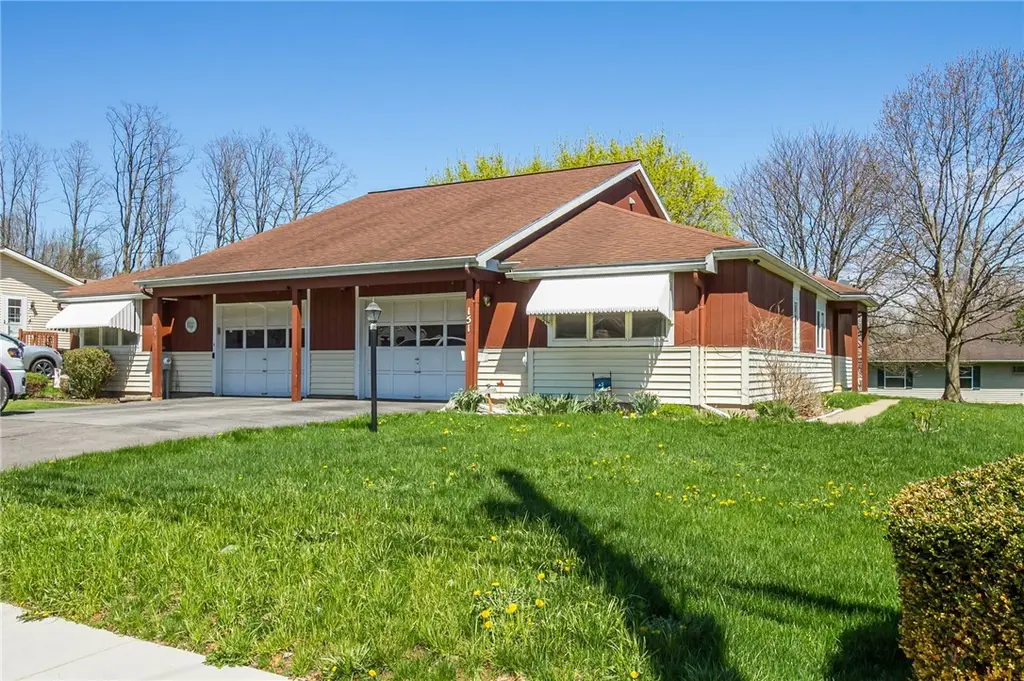
151 N Bloomfield Rd · Canandaigua, NY
Flood risk 1/10 · Minimal
- FEMA flood zone
- X
- Chance of flooding over 30 yrs
- 0.0%
- Est. flood insurance / yr
- $507 – $1,088
Fire risk 1/10 · Minimal
- Est. fire insurance / yr
- $691 – $1,283
Heat risk 2/10 · Minimal
- Hot days now (above 96°F)
- 7 days/yr
- Hot days in 30 yrs
- 16 days/yr
Wind risk 1/10 · Minimal
- Chance of severe wind over 30 yrs
- —
Air-quality risk 2/10 · Minimal
- Unhealthy air days now
- 0 days/yr
- Unhealthy air days in 30 yrs
- 1 days/yr
Risk factors via First Street. Map © Google.
Why this score? — see what drove the D+ grade
The composite is a weighted blend of 9 inputs, each scored 0–100. Each bar is that input's sub-score; the figure is the points it added to the 100-point composite (weight × sub-score).
- ARV discount +14.1/15.0
- Cash flow +12.2/30.0
- Schools +4.7/10.0
- Rent growth +4.6/5.0
- Livability +3.8/5.0
- 1% rule +3.6/10.0
- DSCR +3.6/10.0
- Condition / age +2.5/5.0
- Appreciation +0.0/10.0
$215,000
🖨 Deal sheet (PDF) 📄 Offer letter ✓ Due diligence
Listing remarks MLS
CONVENIENT LIVING. LOW MAINTENANCE RANCH STYLE HOME IN GOOD CONDITION. NEW CARPET. PATIO. WALK TO PARK. FREE LAWN CARE TIL END OF THIS SEASON.
Key facts
- Private deck
- First floor living
- Three parks
Tags
Property features AI
Exterior
- Parking: Attached garage with garage door opener; 1-car garage
- Utilities: Public water connected; Sewer connected; Cable available; High-speed internet available
- Home design: Single-story home; Existing construction
- Construction: Vinyl siding; Attic/crawl hatchway(s) insulated; Block and slab foundation
- Exterior features: Blacktop driveway; Deck
Interior
- Kitchen: Dishwasher; Electric cooktop; Electric oven; Electric range; Microwave; Refrigerator
- Bedrooms: 2 bedrooms on the main level
- Flooring: Laminate; Varied flooring
- Bathrooms: 1 full bathroom; 1 half bathroom; 2 bathrooms on the main level
- Heating & cooling: Electric baseboard heating; Has heating
- Interior features: Ceiling fans; Separate/formal dining room; Separate/formal living room; Great room; Home office; Living/dining room; Accessible doors; Bedroom on main level; Main level primary
- Laundry & utility: Main level laundry; Electric water heater
Neighborhood map
What this means for you Summary
Snapshot
- This is a 2-bed/1.5-bath townhouse listed at $215k.
Deal economics
- At list price, monthly cash flow is $-43 ($-513/yr) — negative.
- To cash-flow at today's rent, offer at most $207k (3.5% below list).
- To meet the 1% rule (rent ≥ 1% of price), the offer needs to be $184k (14.3% below list).
- Recommended offer: $184k (14.3% below list) — sets the bar for 1% rule.
- Cap rate 6.1% vs local median 3.3% in Canandaigua — top-decile yield for the area; either an underpriced asset or a hidden risk that comps aren't pricing in. Stress-test before assuming the spread holds.
Location & tenants
- Location reads 75/100 on livability (#243 in NY, #3,822 nationally) — a middle-class / working-renter tenant base. Strengths: commute A+, housing A+, cost of living B; Watch: employment C-, amenities F, health & safety D-.
- Canandaigua City School District (suburban): math 50% / reading 59% proficiency, ranked #305 of 590 in NY (top 52%) — acceptable for families but not a draw, mixed tenant base, ~2y average lease.
- Zoned schools: Canandaigua Primary-Elementary School (math 37% / reading 49%, grade F, #1,354 of 2,108 statewide, top 64%, 1,475 students, 41% FRL); Canandaigua Middle School (math 38% / reading 55%, grade D+, #330 of 729 statewide, top 46%, 676 students, 0% FRL); Canandaigua Academy (math 100% / reading 92%, grade A+, #71 of 1,100 statewide, top 7%, 1,082 students, 36% FRL) — zoned schools at 26% FRL track the district average.
- Market conditions: Rents rising fast (+8.5%/yr); 223 active listings in the ZIP; 4 comparable units currently listed for rent nearby; rentals lingering (median 46d on market — plan ~5-8 weeks vacancy on turnover, expect pricing pressure); 50% of comp listings sitting > 30 days — soft ceiling on asking rent; solid renter incomes; 284 units permitted in Ontario County in 2024 (69 in 5+ unit buildings).
Forward outlook
- Local home prices are declining (-3.0%/yr); year-one equity from $1k of loan paydown is wiped out by about $6k of value loss. Plan a longer hold.
- Ontario County population projected to shrink 6% by 2050 — rents likely to lag national; underwrite the cash flow, not the appreciation.
Negotiation context
- Only 11 days on market — expect competitive offers; lowballing is unlikely to land.
- 2 sale attempts since 11y ago; this cycle's ask is 8% above the opening price — seller raised mid-cycle; expect resistance to lowballs.
- Current owner paid $112k; list at $215k implies a 91% gain — meaningful room to come down on a strong offer.
Questions for the listing agent
- What do current leases actually rent for vs. the listed asking? Can we see a recent rent roll and the last 12 months of T-12 income?
- Is there a deadline driving the sale (1031 exchange, divorce, estate, relocation)? That informs how much negotiation room exists.
- Schools are B-rated — typically a magnet for longer-tenancy family renters. What's the average tenant stay here, and is there a school-zone premium baked into asking?
- The area grade is low — what's the realistic commute time and amenity access for the typical tenant pool here? Any planned neighborhood developments (good or bad) we should know about?
- What's the average days-on-market for RENTAL listings here right now (not sales)? A rising rental-DOM trend means longer vacancies and softer asking-rent achievability than the comps imply.
- What's the recent tenant-quality profile in this submarket — average credit score on applications, eviction rate, late-payment / NSF rate, and stable-employment percentage? A property-management company in the area should have these aggregated.
- How much new for-sale + rental construction is in the pipeline within 1–3 miles? Heavy new supply typically softens prices + rents 12–24 months out; constrained supply supports both.
Investment metrics
- 1% rule
- 0.86% ✗
- Cap rate
- 6.05%
- Cash-on-cash
- -0.85%
- DSCR
- 0.96
- GRM
- 9.7
CMA / ARV
- ARV (on-the-fly)
- $252,054
- Comps found
- 1
Show comp detail 1 sale within ~0.75 mi
| Address | Dist | Beds/Ba | Sqft | Sold | Price | $/sf | Match |
|---|---|---|---|---|---|---|---|
| 7 Midlakes Dr | 0.47mi | 2/2.0 | 1,438 (+13%) | 0mo | $285,000 | $198 | 54 |
Match score weights: distance 35% · size 25% · config 20% · recency 20%. Top-matched comps best support the ARV.
Projected returns pro-forma
-3.0% appreciation · 8.0% rent growth · sell at horizon
- IRR
- -12.2%
- Equity multiple
- 0.54×
- Total profit
- $-27,782
- Equity at exit
- $32,057
- IRR
- 3.2%
- Equity multiple
- 1.28×
- Total profit
- $16,791
- Equity at exit
- $18,589
Cash invested: $60,200 (down + closing). Projections, not guarantees.
Landlord ↔ Tenant lean methodology
- Overall (STATE)
- 15 Strongly Tenant-Friendly
- State New York
- 15 Strongly Tenant-Friendly · D+10
- County
- — inherits STATE
- City
- — inherits STATE
ZIP-level market 14424
- Home prices YoY
- -21.2%
- Rents YoY
- 8.5%
- Active inventory
- 223
- Price-to-rent
- 9.7×
Monthly cashflow live
- Estimated rent
- $1,843 medium interval (Pro) →
- Mortgage (P&I)
- −$1,127
- Tax from tax record
- −$282 /mo · $3,384/yr
- Insurance
- −$90
- HOA
- −$0
- Vacancy / Maint / Mgmt
- −$387
- Net cashflow
- $-43
Break-even live
Sensitivity live
| Price | -10% $79 | -5% $18 | +0% $-43 | +5% $-104 | +10% $-164 |
|---|---|---|---|---|---|
| Rent | -10% $-188 | -5% $-116 | +0% $-43 | +5% $30 | +10% $103 |
| Rate | -1.0pp $66 | -0.5pp $12 | base $-43 | +0.5pp $-98 | +1.0pp $-155 |
UW: 25.0% down · 7.5% · 30yr · 1.5% tax · 5.0% vac · 8.0% maint · 8.0% mgmt
Financing live
Cash to close
- Down payment
- $53,750
- Closing costs
- $6,450
- Reserves months
- —
- Total cash needed
- —
Loan-product check · same deal, 3 products live
Conventional
25% down · 7.5% · 30yr
- Down + closing
- —
- Monthly P&I
- —
- Monthly cashflow
- —
- DSCR
- —
- Eligible?
- —
Personal DTI + credit; lowest rate.
DSCR
20% down · 8.5% · 30yr
- Down + closing
- —
- Monthly P&I
- —
- Monthly cashflow
- —
- DSCR
- —
- Eligible?
- —
No personal income docs; deal must DSCR.
Hard money
10% down · 12.0% · 12mo
- Down + closing
- —
- Monthly P&I
- —
- Monthly cashflow
- —
- DSCR
- —
- Eligible?
- —
Short-term bridge; refi at stabilization.
Rent comps 4 comps
| Address | Beds | Baths | Sqft | Rent | $/sqft | DOM | Units | Dist |
|---|---|---|---|---|---|---|---|---|
| 9000 Hammocks Dr Unit 3102 Canandaigua, NY | 3.0 | 2.0 | 1356 | $2,314 | $1.71 | 45d | 1 | 1.20mi |
| 9000 Hammocks Dr Unit 2403 Canandaigua, NY | 2.0 | 2.0 | 1398 | $2,281 | $1.63 | 45d | 1 | 1.20mi |
| 292 Mason St Canandaigua, NY | 3.0 | 1.5 | 1225 | $1,800 | $1.47 | 4d | 1 | 1.34mi |
| 79 Saltonstall St Canandaigua, NY | 2.0 | 1.0 | 1000 | $1,290 | $1.29 | 5d | 1 | 1.50mi |
Listing history 23 events
-
2026-06-22days on market $215,000 Active 11 DOM
-
2026-06-18days on market $215,000 Active 8 DOM
-
2026-06-17days on market $215,000 Active 7 DOM
-
2026-06-16days on market $215,000 Active 6 DOM
-
2026-06-15days on market $215,000 Active 5 DOM
-
2026-06-13pricedays on market $215,000 Active 3 DOM
-
2026-06-13statusdays on market $199,900 Active 2 DOM
-
2026-06-10days on market $199,900 Active Under Contract 49 DOM
-
2026-06-09days on market $199,900 Active Under Contract 48 DOM
-
2026-06-09days on market $199,900 Active Under Contract 47 DOM
-
2026-06-07days on market $199,900 Active Under Contract 46 DOM
-
2026-06-03days on market $199,900 Active Under Contract 42 DOM
-
2026-06-03days on market $199,900 Active Under Contract 41 DOM
-
2026-06-01days on market $199,900 Active Under Contract 40 DOM
-
2026-05-31days on market $199,900 Active Under Contract 39 DOM
-
2026-04-30historical Active Under Contract
-
2026-04-22$199,900 Active
-
2015-07-23soldstatus $112,500 Closed Sale or Rented 142-char remark
Show marketing remark (142 chars)
CONVENIENT LIVING. LOW MAINTENANCE RANCH STYLE HOME IN GOOD CONDITION. NEW CARPET. PATIO. WALK TO PARK. FREE LAWN CARE TIL END OF THIS SEASON.
-
2015-07-20soldstatus $112,500
-
2015-06-24status Pending Sale 142-char remark
Show marketing remark (142 chars)
CONVENIENT LIVING. LOW MAINTENANCE RANCH STYLE HOME IN GOOD CONDITION. NEW CARPET. PATIO. WALK TO PARK. FREE LAWN CARE TIL END OF THIS SEASON.
-
2015-06-19$114,900 Active 142-char remark
Show marketing remark (142 chars)
CONVENIENT LIVING. LOW MAINTENANCE RANCH STYLE HOME IN GOOD CONDITION. NEW CARPET. PATIO. WALK TO PARK. FREE LAWN CARE TIL END OF THIS SEASON.
-
2009-09-01soldstatus $105,000
-
2004-08-06soldstatus $109,000
ⓘ Source: listings_history table (triggers on properties + properties_extension) + one-shot
backfill from property_details.listing_events for pre-trigger history.
Tax reassessment forecast NY · Partial reset (capped growth)
- Current annual tax
- $3,384 · $282/mo
- Projected year-2 tax
- $3,509 · $292/mo
- Expected delta
- +$125/yr (+$10/mo · 3.7%)
ⓘ Screening estimate from a state-policy table — verify with the county assessor before closing.
Climate risk First Street
- Flood 1/10 Low FEMA zone X · 0% chance over 30 yrs
- Wildfire 1/10 Low
- Heat 2/10 Low 7 d/yr ≥96°F today · 16 d/yr by 30 yrs out
- Wind 1/10 Low
- Air quality 2/10 Low 0 unhealthy d/yr today · 1 by 30 yrs out
Nearby sold comps map
Loading sold comps map…
Walkable amenities ~0.75 mi
Loading nearby amenities…
Taxation est. · year 1
- Rental income
- $22,121
- − Mortgage interest
- −$12,043
- − Property taxes
- −$3,384
- − Insurance
- −$1,075
- − Repairs & maintenance
- −$1,770
- − Management
- −$1,770
- − Depreciation
- −$6,255
- Taxable loss
- −$4,175
- Est. tax savings @ 24.0%
- +$1,002
- After-tax cash flow
- $489/yr
For passive investors: Depreciation is non-cash, so a rental often shows a tax loss while cash-flowing — sheltering income. Rental losses are passive: they offset passive income freely, and up to $25,000/yr can offset ordinary (W-2) income if you actively participate and your MAGI is under $100k (phasing out to $0 by $150k); unused losses carry forward. On sale, claimed depreciation is recaptured at up to 25%, and gains may owe capital-gains tax (a 1031 exchange can defer both). Figures are a year-1 estimate at your 24.0% rate — not tax advice; consult a CPA.
Schools (NCES district)
- District
- Canandaigua City School District
- NCES district ID
- 3606330
- Math proficiency
- 50% ▼ -10.00%
- Reading proficiency
- 59% ▲ 4.00%
- Median HH income
- $56,375
- Composite
- 47.09/100
- National rank
- #2335
- State rank
- #305 of 590 in NY
Livability — Canandaigua
- Score
- 75/100
- State rank
- #243
- US rank
- #3822
Category grades
Schools grade is shown separately in the Schools card above.
Census & demographics
- Census place
- Canandaigua, NY
- County
- Ontario County · 58,989 people
- City population
- 28,786
- Metro
- Rochester, NY
- Population (ZIP)
- 28,786
- Household income
- $79,778
- Rent vs Own
- Severe rent burden
- 737.0
Population outlook (Ontario County) Hauer SSP2
- Today (2025)
- 111,230 people
- By 2030
- 111,401 · +0.2%
- By 2040
- 109,535 · -1.5%
- By 2050
- 104,895 · -5.7%
- By 2075
- 92,999 · -16.4%
- By 2100
- 73,723 · -33.7%
Race, ethnicity, and origin ACS 2023
- Neighborhood character
- Predominantly White (90%)
- Race & ethnicity
- White 90% Hispanic / Latino 5% Two or more races 5% Black 1%
- Common ancestry
- Romanian 4% Iranian 4% Slovak 3%
- Foreign-born
- 3% · Canada
- Languages at home
- 94% English-only · Spanish 3% German/W. Germanic 1% Arabic 1%
Political lean MEDSL · Ontario
- 2024 margin
- Toss-up / Even · D 49.4% · R 50.6%
- 2008→2024 swing
- -1.0pp toward R · 2008: -0.1pp · 2024: -1.2pp
- All cycles
- 2024: R+1.2 2020: R+0.0 2016: R+8.6 2012: R+1.6 2008: R+0.1
Not yet ingested
- Civics
- —
Market trends
- HPI YoY
- ▼ -70.94%
- Current HPI
- 263.755
- Rent YoY
- ▲ 8.46%
- Metro
- Rochester, NY
- State GDP YoY
- ▲ 2.60%
- F500 in state
- 92
Industry mix (Fortune 500 HQ in NY)
| Industry | F500 HQs | Revenue |
|---|---|---|
| Financial Services | 10 | $950B |
|
||
| Consumer Goods | 9 | $162B |
|
||
| Insurance | 4 | $225B |
|
||
| Telecommunications | 2 | $144B |
|
||
| Pharmaceuticals | 2 | $112B |
|
||
| Media / Entertainment | 2 | $69B |
|
||
Price history
+83.4% since first listed8 events — show timeline
- 2026-04-30 Contingent — UNYREIS
- 2026-04-22 Listed $199,900 UNYREIS
- 2015-07-23 Sold (MLS) $112,500 UNYREIS
- 2015-07-20 Sold (Public Records) $112,500 Public Records
- 2015-06-24 Pending — UNYREIS
- 2015-06-19 Listed $114,900 UNYREIS
- 2009-09-01 Sold (Public Records) $105,000 Public Records
- 2004-08-06 Sold (Public Records) $109,000 Public Records
Property tax history
+4.6%/yrLatest (2025): $3,384 · -1.9% YoY. Source: county tax records.
Cash-flow waterfall
monthlySold comps — $/sqft
last 12 mo · ≤1 miLoading sold comps…