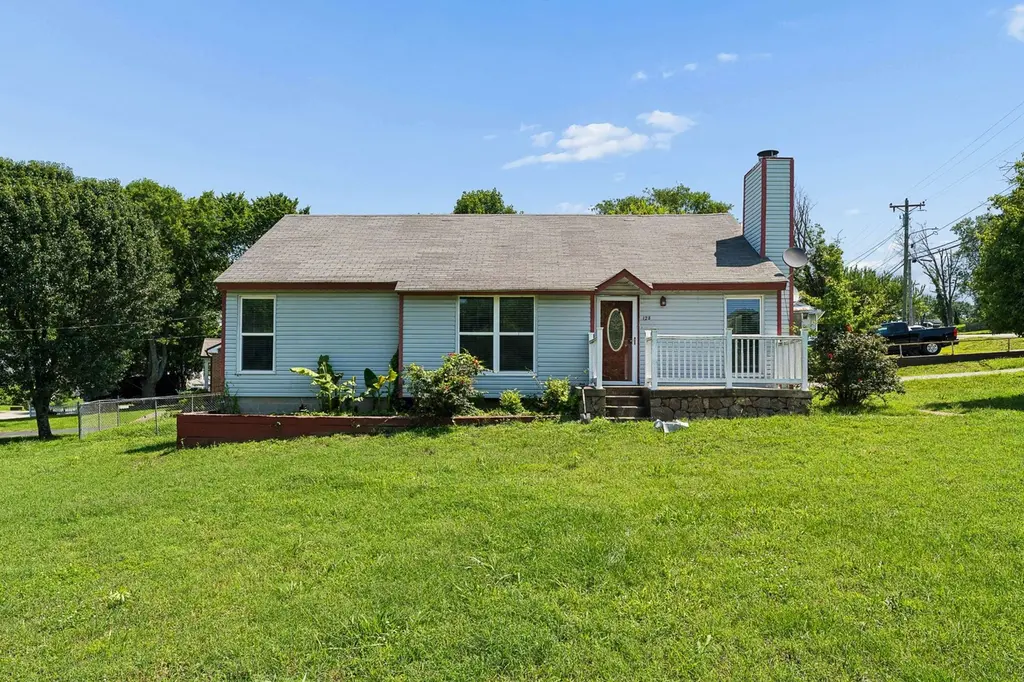
128 Stoneridge Pkwy · La Vergne, TN
Flood risk 7/10 · Major
- FEMA flood zone
- X (unshaded)
- Chance of flooding over 30 yrs
- 0.99%
- Est. flood insurance / yr
- $507 – $1,088
Fire risk 1/10 · Minimal
- Est. fire insurance / yr
- $949 – $1,763
Heat risk 5/10 · Moderate
- Hot days now (above 105°F)
- 7 days/yr
- Hot days in 30 yrs
- 20 days/yr
Wind risk 4/10 · Minor
- Chance of severe wind over 30 yrs
- 9.0%
Air-quality risk 2/10 · Minimal
- Unhealthy air days now
- 1 days/yr
- Unhealthy air days in 30 yrs
- 1 days/yr
Risk factors via First Street. Map © Google.
Why this score? — see what drove the C- grade
The composite is a weighted blend of 9 inputs, each scored 0–100. Each bar is that input's sub-score; the figure is the points it added to the 100-point composite (weight × sub-score).
- Cash flow +16.0/30.0
- ARV discount +15.0/15.0
- DSCR +4.9/10.0
- 1% rule +3.2/10.0
- Schools +3.2/10.0
- Livability +3.2/5.0
- Condition / age +2.5/5.0
- Rent growth +2.2/5.0
- Appreciation +0.0/10.0
$269,900
🖨 Deal sheet 📄 Offer letter ✓ Due diligence
Listing remarks MLS
3-bedroom home with quick access to I-24 and close proximity to Nashville, Murfreesboro, and Smyrna. Large corner lot. Renovated kitchen in 2019 with granite countertops and soft close cabinet drawers. Complete ductwork system replaced in 2019. Windows replaced in 2017. Laminate flooring. Florida Room. Tile shower. Vaulted ceiling in living room with a wood burning fireplace. Fenced backyard features deck and an above ground pool. Storage building remains.
Key facts
- 0.29 acre lot
- Built 1978
- Listed 15 days
Property features AI
Exterior
- Parking: Driveway parking; Concrete parking surface
- Security: Smoke detectors
- Utilities: Public water; Public sewer; Electricity available; Water service available
- Home design: Single-family residence; One story; Residential property
- Construction: Vinyl siding; Shingle roof; Block foundation; Storage structure on property; Year built: existing (assessor)
- Exterior features: Deck; Porch; Back yard fencing; Corner, level lot
Interior
- Kitchen: Electric oven and electric range; Dishwasher; Microwave; Garbage disposal; Stainless steel appliances
- Bedrooms: 3 bedrooms (all on main level); Bedroom sizes approximately 14x10, 13x13, 13x11
- Flooring: Laminate flooring; Tile flooring
- Bathrooms: 1 full bathroom
- Heating & cooling: Central heating (electric); Central air (electric); Ceiling fans
- Interior features: Ceiling fans; High ceilings; Living room wood-burning fireplace (1)
- Laundry & utility: Washer hookup; Electric dryer hookup
Neighborhood map
What this means for you Summary
Snapshot
- This is a 3-bed/2.0-bath single-family listed at $270k.
Deal economics
- At list price, monthly cash flow is $67 ($798/yr) — positive.
- The deal already cash-flows at list — no discount required.
- To meet the 1% rule (rent ≥ 1% of price), the offer needs to be $222k (17.9% below list).
- Recommended offer: $222k (17.9% below list) — sets the bar for 1% rule.
- Cap rate 6.9% vs local median 3.7% in La Vergne — top-decile yield for the area; either an underpriced asset or a hidden risk that comps aren't pricing in. Stress-test before assuming the spread holds.
Location & tenants
- Location reads 64/100 on livability (#171 in TN) — a middle-class / working-renter tenant base. Strengths: cost of living A+, housing A+, employment B; Watch: crime D-, amenities F, commute F.
- Rutherford County (suburban): math 34% / reading 37% proficiency, ranked #22 of 139 in TN (top 16%) — families likely to look elsewhere, expect single-tenant / working-renter base with shorter leases.
- Zoned schools: Rock Springs Elementary (math 38% / reading 34%, grade F, #305 of 952 statewide, top 32%, 1,189 students, 0% FRL); Stewarts Creek High School (math 12% / reading 54%, grade F, #54 of 332 statewide, top 16%, 2,391 students, 0% FRL) — zoned schools average 0% FRL vs 36% district-wide (36 pts lower); this property's tenant base skews higher-income than the district average.
- Market conditions: Rents soft (-1.0%/yr); 261 active listings in the ZIP; 7 comparable units currently listed for rent nearby; rentals leasing fast (median 12d on market — plan ~1-2 weeks tenant-placement turnaround); solid renter incomes; 3,421 units permitted in Rutherford County in 2024 (400 in 5+ unit buildings).
- This rent runs 34% of the median local income ($79k/yr) — at the standard rent-burdened threshold; future hikes will face affordability resistance.
Forward outlook
- Local home prices are declining (-3.0%/yr); year-one equity from $2k of loan paydown is wiped out by about $8k of value loss. Plan a longer hold.
- Rutherford County population projected at +60% by 2050 — long-run rental-demand tailwind backs the buy-and-hold thesis.
Negotiation context
- It's been on market 15 days — a 2% lower offer ($266k) is reasonable based on typical stale-listing flexibility.
- 2 sale attempts since 5y ago with the ask held roughly flat each time — persistent listings suggest the price (not the market) is what's stuck; bring a comps-based counter.
Risks & watch-outs
- Watch-outs: flood insurance adds $66/mo.
- Climate carrying-cost: major flood risk; extreme-heat days projected 7→20/yr by 2055 (HVAC capex compounding) — expect insurance premiums to compound above CPI over the hold.
Questions for the listing agent
- Built in 1978 — when were the roof, HVAC, electrical panel, plumbing, and water heater last replaced?
- What's the actual annual flood-insurance premium (NFIP or private), and is the property in a SFHA with mandatory coverage?
- Is there a deadline driving the sale (1031 exchange, divorce, estate, relocation)? That informs how much negotiation room exists.
- Schools are D-rated, which usually means shorter tenancies and higher turnover. Who's the typical renter profile here, and what's been the actual vacancy rate?
- Crime grade is D in this area — have there been break-ins, vandalism, or insurance claims at this property in the last 3 years? What carrier currently insures it and at what premium?
- What's the average days-on-market for RENTAL listings here right now (not sales)? A rising rental-DOM trend means longer vacancies and softer asking-rent achievability than the comps imply.
- What's the recent tenant-quality profile in this submarket — average credit score on applications, eviction rate, late-payment / NSF rate, and stable-employment percentage? A property-management company in the area should have these aggregated.
- How much new for-sale + rental construction is in the pipeline within 1–3 miles? Heavy new supply typically softens prices + rents 12–24 months out; constrained supply supports both.
Investment metrics
- 1% rule
- 0.82% ✗
- Cap rate
- 6.88%
- Cash-on-cash
- 2.11%
- DSCR
- 1.09
- GRM
- 10.1
CMA / ARV
- ARV (on-the-fly)
- $352,184
- Comps found
- 12
Show comp detail 12 sales within ~0.75 mi
| Address | Dist | Beds/Ba | Sqft | Sold | Price | $/sf | Match |
|---|---|---|---|---|---|---|---|
| 110 Cedar Ridge Dr | 0.14mi | 3/2.0 | 1,250 (-6%) | 3mo | $332,000 | $266 | 82 |
| 606 Blake Moore Dr | 0.16mi | 3/2.0 | 1,302 (-2%) | 12mo | $270,050 | $207 | 80 |
| 127 Brookridge Dr | 0.16mi | 3/2.0 | 1,266 (-4%) | 8mo | $301,000 | $238 | 79 |
| 615 Blake Moore Dr | 0.24mi | 3/2.0 | 1,331 (+0%) | 20mo | $300,000 | $225 | 71 |
| 109 Brookridge Dr | 0.17mi | 3/2.0 | 1,238 (-6%) | 15mo | $307,000 | $248 | 69 |
| 111 Cedar Ridge Dr | 0.16mi | 4/1.5 (+1) | 1,250 (-6%) | 16mo | $320,000 | $256 | 63 |
| 588 Shady Crest Dr | 0.36mi | 3/2.0 | 1,150 (-13%) | 4mo | $315,000 | $274 | 58 |
| 582 Autumn Ct | 0.28mi | 3/2.0 | 1,162 (-12%) | 10mo | $330,000 | $284 | 58 |
| 595 Arbor Ct | 0.36mi | 3/2.0 | 1,141 (-14%) | 14mo | $320,000 | $280 | 49 |
| 579 Autumn Ct | 0.29mi | 3/1.5 | 1,150 (-13%) | 18mo | $320,000 | $278 | 48 |
| 1008 Ash Cir | 0.59mi | 3/2.0 | 1,464 (+11%) | 10mo | $370,000 | $253 | 46 |
| 107 Macaw Ln | 0.58mi | 4/2.5 (+1) | 1,508 (+14%) | 14mo | $419,000 | $278 | 31 |
Match score weights: distance 35% · size 25% · config 20% · recency 20%. Top-matched comps best support the ARV.
Projected returns pro-forma
-3.0% appreciation · 0.0% rent growth · sell at horizon
- IRR
- -17.8%
- Equity multiple
- 0.39×
- Total profit
- $-46,072
- Equity at exit
- $40,243
- IRR
- -16.2%
- Equity multiple
- 0.20×
- Total profit
- $-60,082
- Equity at exit
- $23,336
Cash invested: $75,572 (down + closing). Projections, not guarantees.
Landlord ↔ Tenant lean methodology
- Overall (STATE)
- 87 Strongly Landlord-Friendly
- State Tennessee
- 87 Strongly Landlord-Friendly · R+13
- County
- — inherits STATE
- City
- — inherits STATE
ZIP-level market 37086
- Home prices YoY
- -21.3%
- Rents YoY
- -1.0%
- Active inventory
- 261
- Price-to-rent
- 10.1×
Monthly cashflow live
- Estimated rent
- $2,216 high interval (Pro) →
- Mortgage (P&I)
- −$1,415
- Tax from tax record
- −$90 /mo · $1,082/yr
- Insurance
- −$112
- Flood insurance flood zone
- −$66 /mo · $798/yr
- HOA
- −$0
- Vacancy / Maint / Mgmt
- −$465
- Net cashflow
- $67
Break-even live
UW: 25.0% down · 7.5% · 30yr · 1.5% tax · 5.0% vac · 8.0% maint · 8.0% mgmt
Financing live
Cash to close
- Down payment
- $67,475
- Closing costs
- $8,097
- Reserves months
- —
- Total cash needed
- —
Loan-product check · same deal, 3 products live
Conventional
25% down · 7.5% · 30yr
- Down + closing
- —
- Monthly P&I
- —
- Monthly cashflow
- —
- DSCR
- —
- Eligible?
- —
Personal DTI + credit; lowest rate.
DSCR
20% down · 8.5% · 30yr
- Down + closing
- —
- Monthly P&I
- —
- Monthly cashflow
- —
- DSCR
- —
- Eligible?
- —
No personal income docs; deal must DSCR.
Hard money
10% down · 12.0% · 12mo
- Down + closing
- —
- Monthly P&I
- —
- Monthly cashflow
- —
- DSCR
- —
- Eligible?
- —
Short-term bridge; refi at stabilization.
Rent comps 7 comps
| Address | Beds | Baths | Sqft | Rent | $/sqft | DOM | Units | Dist |
|---|---|---|---|---|---|---|---|---|
| 811 Glade View Ct La Vergne, TN | 4.0 | 1.5 | 1664 | $1,923 | $1.16 | 23d | 1 | 0.19mi |
| 100 Madison Dr La Vergne, TN | 3.0 | 2.5 | 1196 | $1,576 | $1.32 | 4d | 12 | 0.74mi |
| 1029 Milson Ln Unit 1 Nolensville, TN | 2.0 | 2.5 | 1372 | $2,100 | $1.53 | 12d | 1 | 0.83mi |
| 634 Woodland Hills Dr La Vergne, TN | 3.0 | 2.0 | 1408 | $2,150 | $1.53 | 43d | 1 | 0.87mi |
| 708 Goswell Dr Nolensville, TN | 3.0 | 2.0 | 1600 | $2,750 | $1.72 | 23d | 1 | 0.87mi |
| 1071 Large Poppy Dr La Vergne, TN | 3.0 | 2.5 | 1605 | $2,455 | $1.53 | 4d | 1 | 1.43mi |
| 190 Snowdrop Ave La Vergne, TN | 3.0 | 2.0 | 1826 | $2,265 | $1.24 | 2d | 1 | 1.47mi |
Listing history 10 events
-
2026-06-18days on market $269,900 Coming Soon 15 DOM
-
2026-06-17days on market $269,900 Coming Soon 14 DOM
-
2026-06-16days on market $269,900 Coming Soon 13 DOM
-
2026-06-15days on market $269,900 Coming Soon 12 DOM
-
2026-06-13days on market $269,900 Coming Soon 10 DOM
-
2026-06-09days on market $269,900 Coming Soon 6 DOM
-
2026-06-08days on market $269,900 Coming Soon 5 DOM
-
2026-06-07days on market $269,900 Coming Soon 4 DOM
-
2026-06-05remarks 693-char remark
-
2026-06-05$269,900 Coming Soon 1 DOM
ⓘ Source: listings_history table (triggers on properties + properties_extension) + one-shot
backfill from property_details.listing_events for pre-trigger history.
Tax reassessment forecast TN · Resets to sale price
- Current annual tax
- $1,082 · $90/mo
- Projected year-2 tax
- $1,916 · $160/mo
- Expected delta
- +$834/yr (+$70/mo · 77.1%)
ⓘ Screening estimate from a state-policy table — verify with the county assessor before closing.
Climate risk First Street
- Flood 7/10 Severe FEMA zone X (unshaded) · 99% chance over 30 yrs
- Wildfire 1/10 Low
- Heat 5/10 Major 7 d/yr ≥105°F today · 20 d/yr by 30 yrs out
- Wind 4/10 Moderate 9% chance of damaging wind over 30 yrs
- Air quality 2/10 Low 1 unhealthy d/yr today · 1 by 30 yrs out
Nearby sold comps map
Loading sold comps map…
Walkable amenities ~0.75 mi
Loading nearby amenities…
Taxation est. · year 1
- Rental income
- $26,597
- − Mortgage interest
- −$15,119
- − Property taxes
- −$1,082
- − Insurance
- −$2,147
- − Repairs & maintenance
- −$2,128
- − Management
- −$2,128
- − Depreciation
- −$7,852
- Taxable loss
- −$3,858
- Est. tax savings @ 24.0%
- +$926
- After-tax cash flow
- $1,724/yr
For passive investors: Depreciation is non-cash, so a rental often shows a tax loss while cash-flowing — sheltering income. Rental losses are passive: they offset passive income freely, and up to $25,000/yr can offset ordinary (W-2) income if you actively participate and your MAGI is under $100k (phasing out to $0 by $150k); unused losses carry forward. On sale, claimed depreciation is recaptured at up to 25%, and gains may owe capital-gains tax (a 1031 exchange can defer both). Figures are a year-1 estimate at your 24.0% rate — not tax advice; consult a CPA.
Schools (NCES district)
- District
- Rutherford County
- NCES district ID
- 4703690
- Math proficiency
- 34% ▼ -11.00%
- Reading proficiency
- 37% ▼ -4.00%
- Median HH income
- $59,872
- Composite
- 31.7/100
- National rank
- #5917
- State rank
- #22 of 139 in TN
Livability — La Vergne
- Score
- 64/100
- State rank
- #171
- US rank
- #14524
Category grades
Schools grade is shown separately in the Schools card above.
Census & demographics
- Census place
- La Vergne, TN
- County
- Rutherford County · 327,859 people
- City population
- 38,872
- Metro
- Nashville-Davidson--Murfreesboro--Franklin, TN
- Population (ZIP)
- 38,872
- Household income
- $78,857
- Rent vs Own
- Severe rent burden
- 739.0
Population outlook (Rutherford County) Hauer SSP2
- Today (2025)
- 385,165 people
- By 2030
- 430,283 · +11.7%
- By 2040
- 523,241 · +35.8%
- By 2050
- 616,830 · +60.1%
- By 2075
- 848,777 · +120.4%
- By 2100
- 1,028,900 · +167.1%
Race, ethnicity, and origin ACS 2023
- Neighborhood character
- Diverse neighborhood (Simpson 0.68)
- Race & ethnicity
- White 43% Black 28% Hispanic / Latino 24% Two or more races 13% Asian 2%
- Hispanic origin (detail)
- Mexican 12% Puerto Rican 2%
- Common ancestry
- Italian 1% Iranian 1% Lithuanian 1%
- Foreign-born
- 18% · Canada
- Languages at home
- 72% English-only · Spanish 21% Arabic 3% Other Asian/Pacific 1%
Political lean MEDSL · Rutherford
- 2024 margin
- Strong R (+21.8) · D 38.4% · R 60.1% · Other 1.5%
- 2008→2024 swing
- -2.7pp toward R · 2008: -19.1pp · 2024: -21.8pp
- All cycles
- 2024: R+21.8 2020: R+15.4 2016: R+26.1 2012: R+24.7 2008: R+19.1
Not yet ingested
- Civics
- —
Market trends
- HPI YoY
- ▼ -76.52%
- Current HPI
- 282.9844
- Rent YoY
- ▼ -1.04%
- Metro
- Nashville-Davidson--Murfreesboro--Franklin, TN
- State GDP YoY
- ▲ 2.78%
- F500 in state
- 22
Industry mix (Fortune 500 HQ in TN)
| Industry | F500 HQs | Revenue |
|---|---|---|
| Healthcare | 3 | $91B |
|
||
| Retail | 3 | $72B |
|
||
| Transportation / Logistics | 1 | $88B |
|
||
| Paper / Packaging | 1 | $19B |
|
||
| Insurance | 1 | $13B |
|
||
| Energy | 1 | $12B |
|
||
Price history
+0.0% since first listed10 events — show timeline
- 2026-06-03 Coming Soon $269,900 REALTRACS as Distributed by MLS Grid
- 2022-02-22 Sold (Public Records) $270,000 Public Records
- 2022-02-22 Sold (MLS) $270,000 REALTRACS as Distributed by MLS Grid
- 2022-02-16 Pending — REALTRACS as Distributed by MLS Grid
- 2022-01-21 Contingent — REALTRACS as Distributed by MLS Grid
- 2022-01-20 Relisted — REALTRACS as Distributed by MLS Grid
- 2022-01-11 Contingent — REALTRACS as Distributed by MLS Grid
- 2021-12-12 Pending — REALTRACS as Distributed by MLS Grid
- 2021-11-26 Contingent — REALTRACS as Distributed by MLS Grid
- 2021-11-22 Listed $269,900 REALTRACS as Distributed by MLS Grid
Property tax history
+1.9%/yrLatest (2025): $1,082 · +0.0% YoY. Source: county tax records.
Cash-flow waterfall
monthlySold comps — $/sqft
last 12 mo · ≤1 miLoading sold comps…