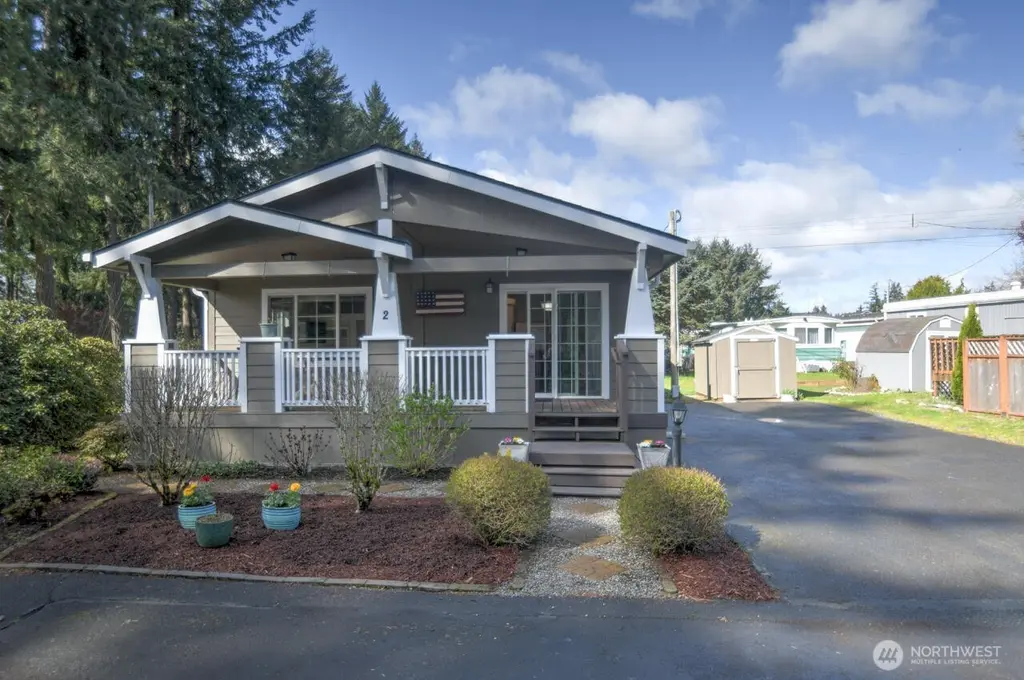
7300 NE 32nd Ave #2 · Lacey, WA
Flood risk 1/10 · Minimal
- FEMA flood zone
- X (unshaded)
- Chance of flooding over 30 yrs
- 0.0%
- Est. flood insurance / yr
- $507 – $1,088
Fire risk 3/10 · Minor
- Est. fire insurance / yr
- $604 – $1,122
Heat risk 3/10 · Minor
- Hot days now (above 88°F)
- 7 days/yr
- Hot days in 30 yrs
- 14 days/yr
Wind risk 1/10 · Minimal
- Chance of severe wind over 30 yrs
- —
Air-quality risk 6/10 · Moderate
- Unhealthy air days now
- 7 days/yr
- Unhealthy air days in 30 yrs
- 8 days/yr
Risk factors via First Street. Map © Google.
Why this score? — see what drove the B grade
The composite is a weighted blend of 9 inputs, each scored 0–100. Each bar is that input's sub-score; the figure is the points it added to the 100-point composite (weight × sub-score).
- Cash flow +30.0/30.0
- 1% rule +10.0/10.0
- DSCR +10.0/10.0
- ARV discount +7.5/15.0
- Schools +5.1/10.0
- Livability +4.2/5.0
- Rent growth +3.4/5.0
- Condition / age +2.5/5.0
- Appreciation +0.0/10.0
$142,000
🖨 Deal sheet 📄 Offer letter ✓ Due diligence
Listing remarks
Step into a lifestyle of comfort and serenity with this nearly new manufactured home, perfectly positioned on a premier, private corner lot. This is a retreat designed for those who appreciate the finer details of 55+ living. An open, flowing floor plan bathed in natural light. The bright kitchen is a chef's dream, complete with an eating bar, dual pantries, and a seamless transition into the formal dining room. The master suite features a generous walk-in closet and a large, private bathroom while a versatile second bedroom and guest bath offer plenty of space for visitors. Enjoy the best of both worlds: the tranquility of a secluded lot with the convenience of being just minutes away from
Key facts
- Bright kitchen
- Formal dining room
- Walk-in closet
Tags
Neighborhood map
What this means for you Summary
Snapshot
- This is a 2-bed/2.0-bath manufactured listed at $142k.
Deal economics
- At list price, monthly cash flow is $941 ($11k/yr) — positive.
- The deal already cash-flows at list — no discount required.
- Meets the 1% rule at list price ($2k rent vs $142k).
- Recommended offer: $133k (6.0% below list) — sets the bar for market timing.
- Cap rate 14.2% vs local median 3.0% in Lacey — top-decile yield for the area; either an underpriced asset or a hidden risk that comps aren't pricing in. Stress-test before assuming the spread holds.
Location & tenants
- Location reads 85/100 on livability (#33 in WA, #581 nationally) — a professional / high-income tenant draw. Strengths: amenities A+, commute A+, housing A+; Watch: cost of living D+.
- North Thurston Public Schools (suburban): math 51% / reading 62% proficiency, ranked #80 of 291 in WA (top 28%) — acceptable for families but not a draw, mixed tenant base, ~2y average lease.
- Market conditions: Rents rising (+3.8%/yr); 218 active listings in the ZIP; 17 comparable units currently listed for rent nearby; rentals at typical pace (median 21d on market — plan ~3-4 weeks tenant-placement turnaround); solid renter incomes; 1,222 units permitted in Thurston County in 2024 (508 in 5+ unit buildings).
Forward outlook
- Local home prices are declining (-3.0%/yr); year-one equity from $982 of loan paydown is wiped out by about $4k of value loss. Plan a longer hold.
- Thurston County population projected at +27% by 2050 — long-run rental-demand tailwind backs the buy-and-hold thesis.
- At projected returns (-3.0% appreciation + 3.8% rent growth), your $40k cash investment doubles in ~5 years — after that, you're playing with house money.
Negotiation context
- It's been on market 72 days — a 6% lower offer ($133k) is reasonable based on typical stale-listing flexibility.
- 3 sale attempts since 26y ago with the ask held roughly flat each time — persistent listings suggest the price (not the market) is what's stuck; bring a comps-based counter.
- Current owner paid $39k; list at $142k implies a 264% gain — meaningful room to come down on a strong offer.
Questions for the listing agent
- It's been on market 72 days. Have you received any prior offers? Is the seller open to a 6% concession, seller financing, or rate buy-down credit?
- Why hasn't it sold? Are there any deal-killer items the seller is aware of (foundation, flood, title, zoning, code violations)?
- Is there a deadline driving the sale (1031 exchange, divorce, estate, relocation)? That informs how much negotiation room exists.
- Schools are B-rated — typically a magnet for longer-tenancy family renters. What's the average tenant stay here, and is there a school-zone premium baked into asking?
- What's the average days-on-market for RENTAL listings here right now (not sales)? A rising rental-DOM trend means longer vacancies and softer asking-rent achievability than the comps imply.
- What's the recent tenant-quality profile in this submarket — average credit score on applications, eviction rate, late-payment / NSF rate, and stable-employment percentage? A property-management company in the area should have these aggregated.
- How much new for-sale + rental construction is in the pipeline within 1–3 miles? Heavy new supply typically softens prices + rents 12–24 months out; constrained supply supports both.
Investment metrics
- 1% rule
- 1.67% ✓
- Cap rate
- 14.25%
- Cash-on-cash
- 28.41%
- DSCR
- 2.26
- GRM
- 5.0
CMA / ARV
- ARV (median comp)
- $28,000
- List price
- $142,000
- Delta
- 407.14%
- Verdict
- OVERPRICED
- Comps
- 1 within 2.0 mi
Show comp detail 1 sale within ~0.75 mi
| Address | Dist | Beds/Ba | Sqft | Sold | Price | $/sf | Match |
|---|---|---|---|---|---|---|---|
| 7300 32nd Ave NE #33 | 0.02mi | 3/2.0 (+1) | 1,296 (+1%) | 14mo | $115,000 | $89 | 81 |
Match score weights: distance 35% · size 25% · config 20% · recency 20%. Top-matched comps best support the ARV.
Projected returns pro-forma
-3.0% appreciation · 3.75% rent growth · sell at horizon
- IRR
- 23.5%
- Equity multiple
- 1.97×
- Total profit
- $38,748
- Equity at exit
- $21,173
- IRR
- 31.9%
- Equity multiple
- 3.98×
- Total profit
- $118,451
- Equity at exit
- $12,278
Cash invested: $39,760 (down + closing). Projections, not guarantees.
Landlord ↔ Tenant lean methodology
- Overall (STATE)
- 28 Tenant-Leaning
- State Washington
- 28 Tenant-Leaning · D+8
- County
- — inherits STATE
- City
- — inherits STATE
ZIP-level market 98516
- Rents YoY
- 3.8%
- Active inventory
- 218
- Price-to-rent
- 5.0×
Monthly cashflow live
- Estimated rent
- $2,366 high interval (Pro) →
- Mortgage (P&I)
- −$745
- Tax from tax record
- −$124 /mo · $1,490/yr
- Insurance
- −$59
- HOA
- −$0
- Vacancy / Maint / Mgmt
- −$497
- Net cashflow
- $941
Break-even live
UW: 25.0% down · 7.5% · 30yr · 1.5% tax · 5.0% vac · 8.0% maint · 8.0% mgmt
Financing live
Cash to close
- Down payment
- $35,500
- Closing costs
- $4,260
- Reserves months
- —
- Total cash needed
- —
Loan-product check · same deal, 3 products live
Conventional
25% down · 7.5% · 30yr
- Down + closing
- —
- Monthly P&I
- —
- Monthly cashflow
- —
- DSCR
- —
- Eligible?
- —
Personal DTI + credit; lowest rate.
DSCR
20% down · 8.5% · 30yr
- Down + closing
- —
- Monthly P&I
- —
- Monthly cashflow
- —
- DSCR
- —
- Eligible?
- —
No personal income docs; deal must DSCR.
Hard money
10% down · 12.0% · 12mo
- Down + closing
- —
- Monthly P&I
- —
- Monthly cashflow
- —
- DSCR
- —
- Eligible?
- —
Short-term bridge; refi at stabilization.
Rent comps 17 comps
| Address | Beds | Baths | Sqft | Rent | $/sqft | DOM | Units | Dist |
|---|---|---|---|---|---|---|---|---|
| 7114 33rd Ave NE Lacey, WA | 3.0 | 2.0 | 1712 | $2,775 | $1.62 | 21d | 1 | 0.16mi |
| 7127 32nd Ave NE Olympia, WA | 1.0–2.0 | 1.0–2.0 | 923 | $2,225 | $2.41 | 1d | 6 | 0.19mi |
| 6913 Delaney Ln NE Unit A Lacey, WA | 3.0 | 2.5 | 1761 | $2,500 | $1.42 | 43d | 1 | 0.28mi |
| 7214 Hayworth Ave NE Olympia, WA | 3.0 | 2.0 | 1765 | $2,450 | $1.39 | 43d | 1 | 0.59mi |
| 6979 Birdseye Ave NE Lacey, WA | 2.0 | 1.0–2.0 | 789 | $2,185 | $2.77 | 10d | 33 | 0.61mi |
| 2417 Fiddleback St NE Lacey, WA | 3.0 | 2.5 | 1790 | $2,800 | $1.56 | 43d | 1 | 0.72mi |
| 4047 Legacy Dr NE Olympia, WA | 1.0 | 1.5 | 1700 | $2,200 | $1.29 | 43d | 1 | 0.95mi |
| 6655 Britton Pkwy NE Lacey, WA | 2.0 | 1.0–2.0 | 731 | $2,373 | $3.24 | 4d | 7 | 0.97mi |
| 4168 Edgewater Blvd NE Lacey, WA | 3.0 | 3.0 | 1509 | $2,595 | $1.72 | 21d | 1 | 1.01mi |
| 7601 Rushmore Way NE Lacey, WA | 3.0 | 2.5 | 1531 | $2,600 | $1.70 | 13d | 1 | 1.14mi |
| 8537 Fortman Dr NE Lacey, WA | 3.0 | 3.0 | 1744 | $2,695 | $1.55 | 13d | 1 | 1.21mi |
| 7612 Kodiak Ave NE Olympia, WA | 3.0 | 2.5 | 1599 | $2,450 | $1.53 | 13d | 1 | 1.24mi |
| 8727 Hanna Ln NE Unit 05-202 * ONE MONTH FREE RENT Lacey, WA | 2.0 | 2.0 | 1015 | $2,045 | $2.01 | 43d | 1 | 1.26mi |
| 8736 Hanna Ln NE Unit 12-103 (ADA) Lacey, WA | 2.0 | 2.0 | 1015 | $2,095 | $2.06 | 21d | 1 | 1.30mi |
| 8739 Hanna Ln NE Unit 7202 Lacey, WA | 2.0 | 2.0 | 1015 | $2,095 | $2.06 | 43d | 1 | 1.30mi |
| 8755 Hanna Ln NE Unit 10-104 Lacey, WA | 2.0 | 2.5 | 1148 | $2,245 | $1.96 | 21d | 1 | 1.32mi |
| 8811 31st Ave NE Lacey, WA | 1.0–3.0 | 1.0–2.0 | 909 | $2,200 | $2.42 | 1d | 13 | 1.41mi |
Listing history 23 events
-
2026-06-18status $142,000 Pending 72 DOM
-
2026-06-17days on market $142,000 Active 72 DOM
-
2026-06-16days on market $142,000 Active 71 DOM
-
2026-06-15days on market $142,000 Active 70 DOM
-
2026-06-14days on market $142,000 Active 68 DOM
-
2026-06-13days on market $142,000 Active 67 DOM
-
2026-06-10days on market $142,000 Active 65 DOM
-
2026-06-09days on market $142,000 Active 64 DOM
-
2026-06-08days on market $142,000 Active 63 DOM
-
2026-06-07statusdays on market $142,000 Active 62 DOM
-
2026-06-03days on market $142,000 Active Under Contract 58 DOM
-
2026-06-02days on market $142,000 Active Under Contract 57 DOM
-
2026-06-01days on market $142,000 Active Under Contract 56 DOM
-
2026-05-31days on market $142,000 Active Under Contract 55 DOM
-
2026-05-30days on market $142,000 Active Under Contract 54 DOM
-
2026-04-06$142,000 Active
-
2012-05-31soldstatus $39,000 Sold
-
2012-05-11status Pending
-
2012-05-01price $39,900
-
2012-04-02price $49,995
-
2012-02-18$55,000 Active
-
2000-09-06soldstatus $13,000
-
2000-07-12$13,000
ⓘ Source: listings_history table (triggers on properties + properties_extension) + one-shot
backfill from property_details.listing_events for pre-trigger history.
Tax reassessment forecast WA · Resets to sale price
- Current annual tax
- $1,490 · $124/mo
- Projected year-2 tax
- $1,490 · $124/mo
- Expected delta
- $0/yr ($0/mo · 0.0%)
ⓘ Screening estimate from a state-policy table — verify with the county assessor before closing.
Climate risk First Street
- Flood 1/10 Low FEMA zone X (unshaded) · 0% chance over 30 yrs
- Wildfire 3/10 Moderate
- Heat 3/10 Moderate 7 d/yr ≥88°F today · 14 d/yr by 30 yrs out
- Wind 1/10 Low
- Air quality 6/10 Major 7 unhealthy d/yr today · 8 by 30 yrs out
Nearby sold comps map
Loading sold comps map…
Walkable amenities ~0.75 mi
Loading nearby amenities…
Taxation est. · year 1
- Rental income
- $28,395
- − Mortgage interest
- −$7,954
- − Property taxes
- −$1,490
- − Insurance
- −$710
- − Repairs & maintenance
- −$2,272
- − Management
- −$2,272
- − Depreciation
- −$4,131
- Taxable income
- $9,567
- Est. tax owed @ 24.0%
- −$2,296
- After-tax cash flow
- $9,000/yr
For passive investors: Depreciation is non-cash, so a rental often shows a tax loss while cash-flowing — sheltering income. Rental losses are passive: they offset passive income freely, and up to $25,000/yr can offset ordinary (W-2) income if you actively participate and your MAGI is under $100k (phasing out to $0 by $150k); unused losses carry forward. On sale, claimed depreciation is recaptured at up to 25%, and gains may owe capital-gains tax (a 1031 exchange can defer both). Figures are a year-1 estimate at your 24.0% rate — not tax advice; consult a CPA.
Schools (NCES district)
- District
- North Thurston Public Schools
- NCES district ID
- 5305850
- Math proficiency
- 51% ▬ 0.00%
- Reading proficiency
- 62% ▬ 0.00%
- Median HH income
- $62,338
- Composite
- 51.09/100
- National rank
- #3798
- State rank
- #80 of 291 in WA
Livability — Lacey
- Score
- 85/100
- State rank
- #33
- US rank
- #581
Category grades
Schools grade is shown separately in the Schools card above.
Census & demographics
- Census place
- Lacey, WA
- County
- Thurston County · 269,345 people
- City population
- 108,850
- Metro
- Olympia-Lacey-Tumwater, WA
- Population (ZIP)
- 29,177
- Household income
- $98,892
- Rent vs Own
- Severe rent burden
- 1202.0
Population outlook (Thurston County) Hauer SSP2
- Today (2025)
- 308,239 people
- By 2030
- 326,483 · +5.9%
- By 2040
- 359,890 · +16.8%
- By 2050
- 391,800 · +27.1%
- By 2075
- 468,024 · +51.8%
- By 2100
- 519,890 · +68.7%
Race, ethnicity, and origin ACS 2023
- Neighborhood character
- Diverse neighborhood (Simpson 0.58)
- Race & ethnicity
- White 62% Two or more races 14% Asian 11% Hispanic / Latino 10% Black 4% Pacific Islander 1%
- Hispanic origin (detail)
- Mexican 6%
- Common ancestry
- Portuguese 3% Lithuanian 2% Iranian 2%
- Foreign-born
- 14% · Canada, Vietnam, South Korea
- Languages at home
- 81% English-only · Spanish 7% Other Asian/Pacific 3% Tagalog/Filipino 2%
Political lean MEDSL · Thurston
- 2024 margin
- Strong D (+20.4) · D 58.5% · R 38.1% · Other 3.5%
- 2008→2024 swing
- -1.3pp toward R · 2008: 21.7pp · 2024: 20.4pp
- All cycles
- 2024: D+20.4 2020: D+18.6 2016: D+15.4 2012: D+19.0 2008: D+21.7
Not yet ingested
- Civics
- —
Market trends
- HPI YoY
- ▼ -203.16%
- Current HPI
- 323.7121
- Rent YoY
- ▲ 3.75%
- Metro
- Olympia-Lacey-Tumwater, WA
- State GDP YoY
- ▲ 4.65%
- F500 in state
- 22
Industry mix (Fortune 500 HQ in WA)
| Industry | F500 HQs | Revenue |
|---|---|---|
| Retail | 2 | $269B |
|
||
| Technology / Retail | 1 | $638B |
|
||
| Technology | 1 | $245B |
|
||
| Telecommunications | 1 | $38B |
|
||
| Food / Beverage | 1 | $36B |
|
||
| Automotive / Trucks | 1 | $34B |
|
||
Price history
+992.3% since first listed8 events — show timeline
- 2026-04-06 Listed $142,000 NWMLS as Distributed by MLS Grid
- 2012-05-31 Sold (MLS) $39,000 NWMLS as Distributed by MLS Grid
- 2012-05-11 Pending — NWMLS as Distributed by MLS Grid
- 2012-05-01 Price Changed $39,900 NWMLS as Distributed by MLS Grid
- 2012-04-02 Price Changed $49,995 NWMLS as Distributed by MLS Grid
- 2012-02-18 Listed $55,000 NWMLS as Distributed by MLS Grid
- 2000-09-06 Sold (MLS) $13,000 NWMLS as Distributed by MLS Grid
- 2000-07-12 Listed $13,000 NWMLS as Distributed by MLS Grid
Property tax history
+7.4%/yrLatest (2026): $1,490 · +10.0% YoY. Source: county tax records.
Cash-flow waterfall
monthlySold comps — $/sqft
last 12 mo · ≤1 miLoading sold comps…