 Duplex
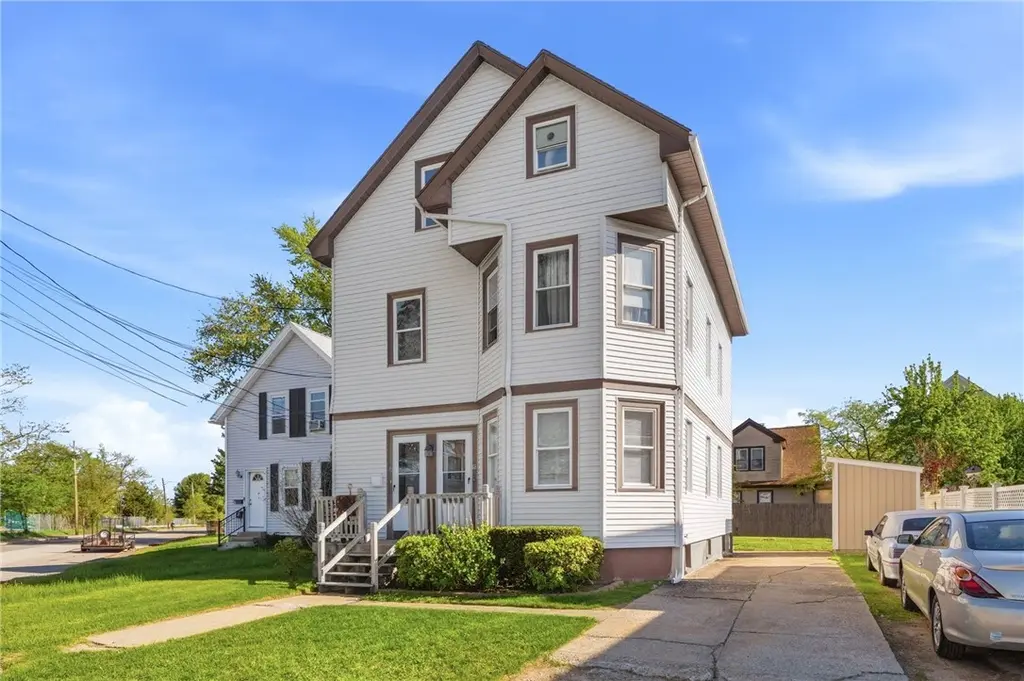
10 Molter St · Cranston, RI
Flood risk 1/10 · Minimal
- FEMA flood zone
- X (unshaded)
- Chance of flooding over 30 yrs
- 0.0%
- Est. flood insurance / yr
- $507 – $1,088
Fire risk 1/10 · Minimal
- Est. fire insurance / yr
- $835 – $1,551
Heat risk 5/10 · Moderate
- Hot days now (above 96°F)
- 7 days/yr
- Hot days in 30 yrs
- 15 days/yr
Wind risk 6/10 · Moderate
- Chance of severe wind over 30 yrs
- 75.0%
Air-quality risk 2/10 · Minimal
- Unhealthy air days now
- 1 days/yr
- Unhealthy air days in 30 yrs
- 2 days/yr
Risk factors via First Street. Map © Google.
Why this score? — see what drove the D grade
The composite is a weighted blend of 9 inputs, each scored 0–100. Each bar is that input's sub-score; the figure is the points it added to the 100-point composite (weight × sub-score).
- Cash flow +12.6/30.0
- ARV discount +9.7/15.0
- Livability +4.4/5.0
- DSCR +3.7/10.0
- 1% rule +2.9/10.0
- Rent growth +2.5/5.0
- Condition / age +2.5/5.0
- Schools +2.3/10.0
- Appreciation +0.0/10.0
$529,900
🖨 Deal sheet (PDF) 📄 Offer letter ✓ Due diligence
Multi-family units
County records classify this as Multi-Family (2-4 Unit). Listing-text estimate: 2 units. confirmed
Listing remarks
Nice 2-family in great neighborhood. 1st floor has 3 beds, pantry, eat- in- kitchen, living room and bath. Vinyl plank flooring in kitchen with hardwoods throughout. Ceiling fans, appliances, laundry, walkout to deck, separate front entrance. 2nd floor has same layout with 2 bedrooms. Full unfinished basement for storage. Full, unfinished 3rd floor with a front and rear entrance for expansion and/or 3rd unit possibility with city approvals. Vinyl siding, replacement windows, new roof in 2011, plenty of parking, yard with deck patio and shed. One heating system, baseboard forced hot water, but 2 separate gas and electric meters. Great location!! Walking distance to Twin Oaks restaurant. Ver
Key facts
- Pantry
- Eat in kitchen
- Living room
Tags
Property features AI
Finance
- Financial info: One unit currently shows actual rent of $1,200
- HOA & community: Community amenities nearby: highway access, public transportation, pool, recreation area, restaurants, shopping, and schools
Exterior
- Parking: No garage; 5 parking spaces total
- Utilities: Public water; Public sewer (connected); Electric service with 100 amp circuit breakers
- Home design: Multi-family property with 2 units across 2 buildings; Three total stories
- Construction: Wood siding and vinyl siding with plaster; Block foundation
- Exterior features: Paved driveway; Fenced yard
Interior
- Kitchen: Oven; Range; Refrigerator
- Bedrooms: One unit with two bedrooms; One unit with three bedrooms
- Flooring: Ceramic tile; Hardwood; Laminate
- Bathrooms: Two full bathrooms total (one in each unit)
- Heating & cooling: Hot water baseboard heating (gas)
- Interior features: Storm doors; Attic with permanent attic stairs; Storage; Stall shower; Tub shower; Full unfinished basement with interior and exterior entry
- Laundry & utility: Washer; Dryer; Gas water heater
Neighborhood map
What this means for you Summary
Snapshot
- This is a 2 × 2-bed/?-bath units multifamily listed at $530k.
Deal economics
- At list price, monthly cash flow is $-71 ($-850/yr) — negative. Per door: $-35/mo.
- To cash-flow at today's rent, offer at most $517k (2.4% below list).
- To meet the 1% rule (rent ≥ 1% of price), the offer needs to be $419k (21.0% below list).
- Recommended offer: $419k (21.0% below list) — sets the bar for 1% rule.
- Cap rate 6.1% vs local median 3.2% in Cranston — top-decile yield for the area; either an underpriced asset or a hidden risk that comps aren't pricing in. Stress-test before assuming the spread holds.
Location & tenants
- Location reads 87/100 on livability (#1 in RI, #323 nationally) — a professional / high-income tenant draw. Strengths: crime A+, employment A+, housing A+.
- Cranston (suburban): math 16% / reading 35% proficiency, ranked #23 of 39 in RI (top 59%) — low school quality limits family demand, transient renter base, plan for 1-2y turnover.
- Zoned schools: Stadium School (math 12% / reading 32%, grade F, #106 of 167 statewide, top 66%, 229 students, 60% FRL); Hugh B. Bain Middle School (math 6% / reading 12%, grade F, #46 of 57 statewide, top 80%, 561 students, 68% FRL); Cranston High School East (math 14% / reading 40%, grade F, #34 of 58 statewide, top 58%, 1,499 students, 59% FRL) — zoned schools average 62% FRL vs 33% district-wide (29 pts higher); higher-poverty schools than district average — tighter screening recommended.
- Market conditions: 78 active listings in the ZIP; 1 comparable units currently listed for rent nearby; solid renter incomes; 776 units permitted in Providence County in 2024 (229 in 5+ unit buildings).
- At $4,187/mo this rent would consume 55% of the median local household income ($91k/yr) (locally 480% of renters already pay >50% of income on rent) — very limited rent-growth headroom before tenants either downsize or default.
Forward outlook
- Local home prices are declining (-3.0%/yr); year-one equity from $4k of loan paydown is wiped out by about $16k of value loss. Plan a longer hold.
- Providence County population projected at +5% by 2050 — modest demand growth; plan on rents tracking national, not racing it.
Negotiation context
- Only 4 days on market — expect competitive offers; lowballing is unlikely to land.
Risks & watch-outs
- Watch-outs: built in 1920 — expect roof / HVAC / electrical / plumbing capex.
- Climate carrying-cost: major wind risk, 75% chance of damaging wind over 30y; extreme-heat days projected 7→15/yr by 2055 (HVAC capex compounding) — expect insurance premiums to compound above CPI over the hold.
Questions for the listing agent
- What do current leases actually rent for vs. the listed asking? Can we see a recent rent roll and the last 12 months of T-12 income?
- Can we see the unit-by-unit rent roll, current vacancy, and any below-market leases? What's the average tenancy length?
- What capital expenditures (roof, boiler, parking lot, exteriors) have been made in the last 5 years, and what's planned in the next 2?
- Built in 1920 — when were the roof, HVAC, electrical panel, plumbing, and water heater last replaced?
- Is there a deadline driving the sale (1031 exchange, divorce, estate, relocation)? That informs how much negotiation room exists.
- The area grade is low — what's the realistic commute time and amenity access for the typical tenant pool here? Any planned neighborhood developments (good or bad) we should know about?
- What's the average days-on-market for RENTAL listings here right now (not sales)? A rising rental-DOM trend means longer vacancies and softer asking-rent achievability than the comps imply.
- What's the recent tenant-quality profile in this submarket — average credit score on applications, eviction rate, late-payment / NSF rate, and stable-employment percentage? A property-management company in the area should have these aggregated.
- How much new apartment / multifamily construction is in the pipeline within 1–3 miles? Heavy new supply (>2% of stock underway) typically softens rents 12–24 months out; light construction supports rent growth.
Investment metrics
- 1% rule
- 0.79% ✗
- Cap rate
- 6.13%
- Cash-on-cash
- -0.57%
- DSCR
- 0.97
- GRM
- 10.5
CMA / ARV
- ARV (on-the-fly)
- $557,295
- Comps found
- 7
Show comp detail 7 sales within ~0.75 mi
| Address | Dist | Beds/Ba | Sqft | Sold | Price | $/sf | Match |
|---|---|---|---|---|---|---|---|
| 71 73 Carlton St | 0.18mi | 4/2.0 (-1) | 2,016 (-4%) | 12mo | $625,000 | $310 | 70 |
| 130 Wollaston St | 0.68mi | 4/2.0 (-1) | 2,160 (+3%) | 6mo | $455,000 | $211 | 54 |
| 210 -212 Crescent Ave | 0.43mi | 5/2.0 | 1,843 (-12%) | 6mo | $540,000 | $293 | 54 |
| 186 Elsie St | 0.56mi | 4/2.0 (-1) | 2,013 (-4%) | 13mo | $534,000 | $265 | 51 |
| 157 159 Jordan Ave | 0.61mi | 4/3.0 (-1) | 1,904 (-10%) | 2mo | $610,000 | $320 | 45 |
| 1136 Park Ave | 0.70mi | 6/3.0 (+1) | 2,200 (+5%) | 23mo | $535,000 | $243 | 32 |
| 1254 Cranston St | 0.72mi | 5/3.0 | 2,313 (+10%) | 24mo | $530,000 | $229 | 26 |
Match score weights: distance 35% · size 25% · config 20% · recency 20%. Top-matched comps best support the ARV.
Projected returns pro-forma
-3.0% appreciation · 3.0% rent growth · sell at horizon
- IRR
- -17.3%
- Equity multiple
- 0.39×
- Total profit
- $-90,489
- Equity at exit
- $79,010
- IRR
- -9.3%
- Equity multiple
- 0.43×
- Total profit
- $-85,056
- Equity at exit
- $45,816
Cash invested: $148,372 (down + closing). Projections, not guarantees.
Landlord ↔ Tenant lean methodology
- Overall (STATE)
- 31 Tenant-Leaning
- State Rhode Island
- 31 Tenant-Leaning · D+8
- County
- — inherits STATE
- City
- — inherits STATE
ZIP-level market 02910
- Active inventory
- 78
- Price-to-rent
- 21.1×
Monthly cashflow live
- Estimated rent
- $4,187 high interval (Pro) →
- Mortgage (P&I)
- −$2,779
- Tax from tax record
- −$379 /mo · $4,547/yr
- Insurance
- −$221
- HOA
- −$0
- Vacancy / Maint / Mgmt
- −$879
- Net cashflow
- $-71
Break-even live
Sensitivity live
| Price | -10% $229 | -5% $79 | +0% $-71 | +5% $-221 | +10% $-371 |
|---|---|---|---|---|---|
| Rent | -10% $-402 | -5% $-236 | +0% $-71 | +5% $95 | +10% $260 |
| Rate | -1.0pp $196 | -0.5pp $64 | base $-71 | +0.5pp $-208 | +1.0pp $-348 |
2-unit breakdown (identical units grouped — click to expand)
| Units | Beds | Baths | Est. rent |
|---|---|---|---|
| 2× units | 2 | — | $4,188 |
| #1 | 2 | — | $2,094 |
| #2 | 2 | — | $2,094 |
| Total (2 units) | $4,187 | ||
UW: 25.0% down · 7.5% · 30yr · 1.5% tax · 5.0% vac · 8.0% maint · 8.0% mgmt
Financing live
Cash to close
- Down payment
- $132,475
- Closing costs
- $15,897
- Reserves months
- —
- Total cash needed
- —
Loan-product check · same deal, 3 products live
Conventional
25% down · 7.5% · 30yr
- Down + closing
- —
- Monthly P&I
- —
- Monthly cashflow
- —
- DSCR
- —
- Eligible?
- —
Personal DTI + credit; lowest rate.
DSCR
20% down · 8.5% · 30yr
- Down + closing
- —
- Monthly P&I
- —
- Monthly cashflow
- —
- DSCR
- —
- Eligible?
- —
No personal income docs; deal must DSCR.
Hard money
10% down · 12.0% · 12mo
- Down + closing
- —
- Monthly P&I
- —
- Monthly cashflow
- —
- DSCR
- —
- Eligible?
- —
Short-term bridge; refi at stabilization.
Rent comps 1 comps
| Address | Beds | Baths | Sqft | Rent | $/sqft | DOM | Units | Dist |
|---|---|---|---|---|---|---|---|---|
| 14 Calef St Unit 16 Cranston, RI | 5.0 | 3.0 | 3000 | $3,500 | $1.17 | 19d | 1 | 0.77mi |
Listing history 2 events
-
2026-05-13status Pending
-
2026-05-09$529,900 Active
ⓘ Source: listings_history table (triggers on properties + properties_extension) + one-shot
backfill from property_details.listing_events for pre-trigger history.
Tax reassessment forecast RI · Partial reset (capped growth)
- Current annual tax
- $4,547 · $379/mo
- Projected year-2 tax
- $6,592 · $549/mo
- Expected delta
- +$2,045/yr (+$170/mo · 45.0%)
ⓘ Screening estimate from a state-policy table — verify with the county assessor before closing.
Climate risk First Street
- Flood 1/10 Low FEMA zone X (unshaded) · 0% chance over 30 yrs
- Wildfire 1/10 Low
- Heat 5/10 Major 7 d/yr ≥96°F today · 15 d/yr by 30 yrs out
- Wind 6/10 Major 75% chance of damaging wind over 30 yrs
- Air quality 2/10 Low 1 unhealthy d/yr today · 2 by 30 yrs out
Nearby sold comps map
Loading sold comps map…
Walkable amenities ~0.75 mi
Loading nearby amenities…
Taxation est. · year 1
- Rental income
- $50,244
- − Mortgage interest
- −$29,683
- − Property taxes
- −$4,547
- − Insurance
- −$2,650
- − Repairs & maintenance
- −$4,020
- − Management
- −$4,020
- − Depreciation
- −$15,415
- Taxable loss
- −$10,089
- Est. tax savings @ 24.0%
- +$2,421
- After-tax cash flow
- $1,571/yr
For passive investors: Depreciation is non-cash, so a rental often shows a tax loss while cash-flowing — sheltering income. Rental losses are passive: they offset passive income freely, and up to $25,000/yr can offset ordinary (W-2) income if you actively participate and your MAGI is under $100k (phasing out to $0 by $150k); unused losses carry forward. On sale, claimed depreciation is recaptured at up to 25%, and gains may owe capital-gains tax (a 1031 exchange can defer both). Figures are a year-1 estimate at your 24.0% rate — not tax advice; consult a CPA.
Schools (NCES district)
- District
- Cranston
- NCES district ID
- 4400240
- Math proficiency
- 16% ▼ -11.00%
- Reading proficiency
- 35% ▼ -7.00%
- Median HH income
- $60,070
- Composite
- 23.36/100
- National rank
- #7910
- State rank
- #23 of 39 in RI
Livability — Cranston
- Score
- 87/100
- State rank
- #1
- US rank
- #323
Category grades
Schools grade is shown separately in the Schools card above.
Census & demographics
- Census place
- Cranston, RI
- County
- Providence County · 548,917 people
- City population
- 72,803
- Metro
- Providence-Warwick, RI-MA
- Population (ZIP)
- 23,499
- Household income
- $90,698
- Rent vs Own
- Severe rent burden
- 480.0
Population outlook (Providence County) Hauer SSP2
- Today (2025)
- 653,469 people
- By 2030
- 660,819 · +1.1%
- By 2040
- 672,747 · +3.0%
- By 2050
- 683,741 · +4.6%
- By 2075
- 720,435 · +10.2%
- By 2100
- 741,582 · +13.5%
Race, ethnicity, and origin ACS 2023
- Neighborhood character
- Diverse neighborhood (Simpson 0.59)
- Race & ethnicity
- White 59% Hispanic / Latino 22% Two or more races 13% Asian 8% Black 4% Native American 1%
- Hispanic origin (detail)
- Mexican 1% Puerto Rican 3% Dominican 9%
- Common ancestry
- Russian 5% Lithuanian 4% Romanian 2%
- Foreign-born
- 17% · Canada, China, Vietnam
- Languages at home
- 72% English-only · Spanish 15% Other Indo-European 3% Chinese 2%
Political lean MEDSL · Providence
- 2024 margin
- D (+14.4) · D 56.1% · R 41.7% · Other 2.2%
- 2008→2024 swing
- -20.0pp toward R · 2008: 34.4pp · 2024: 14.4pp
- All cycles
- 2024: D+14.4 2020: D+22.9 2016: D+21.2 2012: D+34.9 2008: D+34.4
Not yet ingested
- Civics
- —
Market trends
- HPI YoY
- ▼ -511.50%
- Current HPI
- 358.6283
- Rent YoY
- —
- Metro
- Providence-Warwick, RI-MA
- State GDP YoY
- ▲ 2.25%
- F500 in state
- 10
Industry mix (Fortune 500 HQ in RI)
| Industry | F500 HQs | Revenue |
|---|---|---|
| Healthcare | 1 | $373B |
|
||
| Food Distribution | 1 | $31B |
|
||
| Aerospace / Defense | 1 | $14B |
|
||
| Financial Services | 1 | $8B |
|
||
| Consumer Goods | 1 | $4B |
|
||
Price history
2 events — show timeline
- 2026-05-13 Pending — RIS
- 2026-05-09 Listed $529,900 RIS
Property tax history
+2.5%/yrLatest (2025): $4,547 · +2.0% YoY. Source: county tax records.
Cash-flow waterfall
monthlySold comps — $/sqft
last 12 mo · ≤1 miLoading sold comps…