 Multi-family
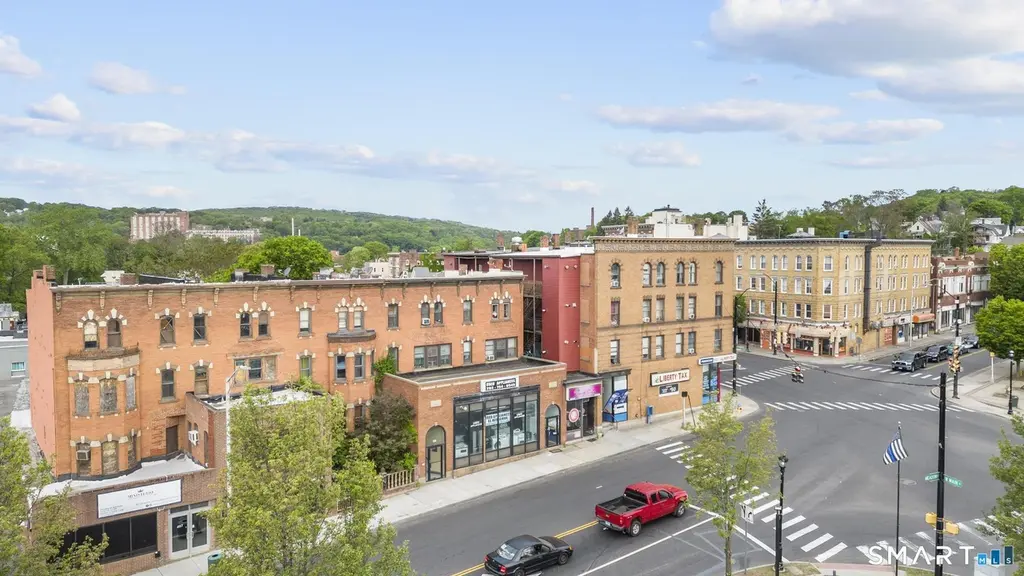
343 W Main St · Waterbury, CT
Flood risk No data
- FEMA flood zone
- —
- Chance of flooding over 30 yrs
- —
- Est. flood insurance / yr
- —
Fire risk No data
- Est. fire insurance / yr
- —
Heat risk No data
- Hot days now (above threshold)
- —
- Hot days in 30 yrs
- —
Wind risk No data
- Chance of severe wind over 30 yrs
- —
Air-quality risk No data
- Unhealthy air days now
- —
- Unhealthy air days in 30 yrs
- —
Risk factors via First Street. Map © Google.
Why this score? — see what drove the C- grade
The composite is a weighted blend of 9 inputs, each scored 0–100. Each bar is that input's sub-score; the figure is the points it added to the 100-point composite (weight × sub-score).
- Cash flow +21.9/30.0
- DSCR +7.0/10.0
- 1% rule +5.7/10.0
- Appreciation +5.0/10.0
- Livability +4.0/5.0
- Condition / age +4.0/5.0
- Rent growth +2.5/5.0
- ARV discount +1.6/15.0
- Schools +1.5/10.0
$2,625,000
🖨 Deal sheet (PDF) 📄 Offer letter ✓ Due diligence
Multi-family units
County records classify this as Multi-Family (5+ Unit). Listing-text estimate: 1 unit. estimate disagrees with records
5+ unit building — per-unit beds/baths from public records are typically unavailable; the breakdown below (if shown) is an estimate from the listing text.
Listing remarks
Exceptional mixed-use investment opportunity Downtown featuring three contiguous parcels totaling 0.42 acres with 26,948 SF of GLA. The offering includes two mixed-use buildings (343-367 West Main St & 495 Meadow St, Waterbury) plus a 31-car parking lot (367 West Main St), providing strong infrastructure for both residential and commercial tenancy. The property consists of 6 ground-level commercial units with stable, long-term tenants, and 21 residential apartments with a unit mix of (3) one-bedroom, (16) two-bedroom, and (2) three-bedroom units. Residential occupancy has historically remained high, reflecting consistent rental demand. Many units have been updated with modern flooring
Key facts
- Renovated kitchens
- 7,840 sq ft lot
- 31 parking spots
Tags
Property features AI
Exterior
- Parking: Off-street parking; 31 total parking spaces
- Utilities: Public water connected; Public sewer connected; Natural gas hot water
- Home design: Multi-family property (5+ units)
- Construction: Masonry and stone foundation; Brick construction; Flat roof
- Exterior features: Brick exterior; Sidewalk; Porch; Exterior lighting; Corner lot; Level lot
Interior
- Bedrooms: 3 bedrooms
- Bathrooms: 1 full bathroom
- Heating & cooling: Hot air heating; Natural gas heating
- Interior features: Window air conditioning units; Full unfinished basement
Neighborhood map
What this means for you Summary
Snapshot
- This is a 3-bed/1.0-bath multifamily listed at $2.62M. Condition is rated good.
Deal economics
- At list price, monthly cash flow is $4k ($49k/yr) — positive.
- The deal already cash-flows at list — no discount required.
- Meets the 1% rule at list price ($28k rent vs $2.62M).
- Recommended offer: $2.47M (6.0% below list) — sets the bar for market timing.
- Cap rate 8.2% vs local median 3.5% in Waterbury — top-decile yield for the area; either an underpriced asset or a hidden risk that comps aren't pricing in. Stress-test before assuming the spread holds.
Location & tenants
- Location reads 79/100 on livability (#32 in CT, #2,205 nationally) — a middle-class / working-renter tenant base. Strengths: commute A+, cost of living A+, housing A+; Watch: crime D, employment D.
- Waterbury School District (suburban): math 12% / reading 23% proficiency, ranked #148 of 153 in CT (top 97%) — low school quality limits family demand, transient renter base, plan for 1-2y turnover; 73% free/reduced lunch — lower-income household profile, screen leases tightly.
- Zoned schools: Bunker Hill School (math 8% / reading 17%, grade F, #490 of 553 statewide, top 90%, 468 students, 76% FRL); West Side Middle School (math 8% / reading 23%, grade F, #165 of 175 statewide, top 94%, 817 students, 81% FRL); John F. Kennedy High School (math 17% / reading 37%, grade F, #147 of 194 statewide, top 78%, 1,297 students, 79% FRL).
- Market conditions: 5 active listings in the ZIP; lower-income renter base — watch delinquency; 502 units permitted in Naugatuck Valley Planning Region in 2024 (171 in 5+ unit buildings).
- At $28,164/mo this rent would consume 2335% of the median local household income ($14k/yr) (locally 729% of renters already pay >50% of income on rent) — very limited rent-growth headroom before tenants either downsize or default.
Forward outlook
- In year one you build about $97k of equity ($18k loan paydown + $79k appreciation (3.0% local appreciation)).
- At projected returns (3.0% appreciation + 3.0% rent growth), your $735k cash investment doubles in ~5 years — after that, you're playing with house money.
- By year 2, paydown + projected appreciation supports a ~$158k cash-out refi (75% LTV) — recoverable capital for the next deal without selling this one.
Negotiation context
- It's been on market 61 days — a 6% lower offer ($2.47M) is reasonable based on typical stale-listing flexibility.
- 2 sale attempts with the ask held roughly flat each time — persistent listings suggest the price (not the market) is what's stuck; bring a comps-based counter.
Risks & watch-outs
- Watch-outs: built in 1900 — expect roof / HVAC / electrical / plumbing capex.
Questions for the listing agent
- It's been on market 61 days. Have you received any prior offers? Is the seller open to a 6% concession, seller financing, or rate buy-down credit?
- Built in 1900 — when were the roof, HVAC, electrical panel, plumbing, and water heater last replaced?
- Why hasn't it sold? Are there any deal-killer items the seller is aware of (foundation, flood, title, zoning, code violations)?
- Is there a deadline driving the sale (1031 exchange, divorce, estate, relocation)? That informs how much negotiation room exists.
- Schools are D-rated, which usually means shorter tenancies and higher turnover. Who's the typical renter profile here, and what's been the actual vacancy rate?
- Crime grade is D in this area — have there been break-ins, vandalism, or insurance claims at this property in the last 3 years? What carrier currently insures it and at what premium?
- What's the average days-on-market for RENTAL listings here right now (not sales)? A rising rental-DOM trend means longer vacancies and softer asking-rent achievability than the comps imply.
- What's the recent tenant-quality profile in this submarket — average credit score on applications, eviction rate, late-payment / NSF rate, and stable-employment percentage? A property-management company in the area should have these aggregated.
- How much new apartment / multifamily construction is in the pipeline within 1–3 miles? Heavy new supply (>2% of stock underway) typically softens rents 12–24 months out; light construction supports rent growth.
Investment metrics
- 1% rule
- 1.07% ✓
- Cap rate
- 8.17%
- Cash-on-cash
- 6.71%
- DSCR
- 1.30
- GRM
- 7.8
CMA / ARV
- ARV (median comp)
- $2,320,504
- List price
- $2,625,000
- Delta
- 13.12%
- Verdict
- OVERPRICED
- Comps
- 2 within 1.0 mi
Projected returns pro-forma
3.0% appreciation · 3.0% rent growth · sell at horizon
- IRR
- 13.8%
- Equity multiple
- 1.79×
- Total profit
- $578,335
- Equity at exit
- $1,180,314
- IRR
- 15.6%
- Equity multiple
- 3.30×
- Total profit
- $1,693,061
- Equity at exit
- $1,819,004
Cash invested: $735,000 (down + closing). Projections, not guarantees.
Landlord ↔ Tenant lean methodology
- Overall (STATE)
- 27 Tenant-Leaning
- State Connecticut
- 27 Tenant-Leaning · D+7
- County
- — inherits STATE
- City
- — inherits STATE
ZIP-level market 06702
- Active inventory
- 5
- Price-to-rent
- 175.9×
Monthly cashflow live
- Estimated rent
- $28,164 high interval (Pro) →
- Mortgage (P&I)
- −$13,766
- Tax est. 1.5%
- −$3,281 /mo · $39,375/yr
- Insurance
- −$1,094
- HOA
- −$0
- Vacancy / Maint / Mgmt
- −$5,914
- Net cashflow
- $4,109
Break-even live
Sensitivity live
| Price | -10% $5,923 | -5% $5,016 | +0% $4,109 | +5% $3,202 | +10% $2,295 |
|---|---|---|---|---|---|
| Rent | -10% $1,884 | -5% $2,996 | +0% $4,109 | +5% $5,221 | +10% $6,334 |
| Rate | -1.0pp $5,431 | -0.5pp $4,776 | base $4,109 | +0.5pp $3,429 | +1.0pp $2,737 |
21-unit breakdown (identical units grouped — click to expand)
| Units | Beds | Baths | Est. rent |
|---|---|---|---|
| 3× units | 1 | 1 | $3,732 |
| #1 | 1 | 1 | $1,244 |
| #2 | 1 | 1 | $1,244 |
| #3 | 1 | 1 | $1,244 |
| 16× units | 2 | 1 | $21,408 |
| #4 | 2 | 1 | $1,338 |
| #5 | 2 | 1 | $1,338 |
| #6 | 2 | 1 | $1,338 |
| #7 | 2 | 1 | $1,338 |
| #8 | 2 | 1 | $1,338 |
| #9 | 2 | 1 | $1,338 |
| #10 | 2 | 1 | $1,338 |
| #11 | 2 | 1 | $1,338 |
| #12 | 2 | 1 | $1,338 |
| #13 | 2 | 1 | $1,338 |
| #14 | 2 | 1 | $1,338 |
| #15 | 2 | 1 | $1,338 |
| #16 | 2 | 1 | $1,338 |
| #17 | 2 | 1 | $1,338 |
| #18 | 2 | 1 | $1,338 |
| #19 | 2 | 1 | $1,338 |
| 2× units | 3 | 1 | $3,022 |
| #20 | 3 | 1 | $1,511 |
| #21 | 3 | 1 | $1,511 |
| Total (21 units) | $28,164 | ||
UW: 25.0% down · 7.5% · 30yr · 1.5% tax · 5.0% vac · 8.0% maint · 8.0% mgmt
Financing live
Cash to close
- Down payment
- $656,250
- Closing costs
- $78,750
- Reserves months
- —
- Total cash needed
- —
Loan-product check · same deal, 3 products live
Conventional
25% down · 7.5% · 30yr
- Down + closing
- —
- Monthly P&I
- —
- Monthly cashflow
- —
- DSCR
- —
- Eligible?
- —
Personal DTI + credit; lowest rate.
DSCR
20% down · 8.5% · 30yr
- Down + closing
- —
- Monthly P&I
- —
- Monthly cashflow
- —
- DSCR
- —
- Eligible?
- —
No personal income docs; deal must DSCR.
Hard money
10% down · 12.0% · 12mo
- Down + closing
- —
- Monthly P&I
- —
- Monthly cashflow
- —
- DSCR
- —
- Eligible?
- —
Short-term bridge; refi at stabilization.
Listing history 22 events
-
2026-06-21days on market $2,625,000 Active 61 DOM
-
2026-06-18days on market $2,625,000 Active 58 DOM
-
2026-06-17days on market $2,625,000 Active 57 DOM
-
2026-06-16days on market $2,625,000 Active 56 DOM
-
2026-06-15days on market $2,625,000 Active 55 DOM
-
2026-06-14days on market $2,625,000 Active 53 DOM
-
2026-06-13days on market $2,625,000 Active 52 DOM
-
2026-06-10days on market $2,625,000 Active 50 DOM
-
2026-06-09days on market $2,625,000 Active 49 DOM
-
2026-06-08days on market $2,625,000 Active 48 DOM
-
2026-06-07days on market $2,625,000 Active 47 DOM
-
2026-06-05days on market $2,625,000 Active 44 DOM
-
2026-06-03days on market $2,625,000 Active 43 DOM
-
2026-06-03days on market $2,625,000 Active 42 DOM
-
2026-06-01days on market $2,625,000 Active 41 DOM
-
2026-05-31days on market $2,625,000 Active 40 DOM
-
2026-04-21historical
-
2026-04-21$2,650,000 Active 1462-char remark
-
2026-03-08price $2,700,000
-
2026-03-08price $2,750,000
-
2026-03-07price $2,650,000
-
2026-01-28$2,750,000 Active
ⓘ Source: listings_history table (triggers on properties + properties_extension) + one-shot
backfill from property_details.listing_events for pre-trigger history.
Nearby sold comps map
Loading sold comps map…
Walkable amenities ~0.75 mi
Loading nearby amenities…
Taxation est. · year 1
- Rental income
- $337,968
- − Mortgage interest
- −$147,041
- − Property taxes
- −$39,375
- − Insurance
- −$13,125
- − Repairs & maintenance
- −$27,037
- − Management
- −$27,037
- − Depreciation
- −$76,364
- Taxable income
- $7,989
- Est. tax owed @ 24.0%
- −$1,917
- After-tax cash flow
- $47,388/yr
For passive investors: Depreciation is non-cash, so a rental often shows a tax loss while cash-flowing — sheltering income. Rental losses are passive: they offset passive income freely, and up to $25,000/yr can offset ordinary (W-2) income if you actively participate and your MAGI is under $100k (phasing out to $0 by $150k); unused losses carry forward. On sale, claimed depreciation is recaptured at up to 25%, and gains may owe capital-gains tax (a 1031 exchange can defer both). Figures are a year-1 estimate at your 24.0% rate — not tax advice; consult a CPA.
Condition & rehab AI · 12 photos
This mixed-use property offers a good investment opportunity with minimal repairs and maintenance needed. The property is well-maintained and ready for immediate rental or resale.
Value-add opportunities
- Both Paint exterior walls — Enhances curb appeal and property value.
- Both Clean gutters — Improves drainage and property value.
- Both Install energy-efficient windows — Reduces energy costs and enhances property value.
- Resale Update kitchen appliances — Modernizes the kitchen and attracts buyers.
- Rental Install smart home features — Attracts tech-savvy renters and enhances property value.
Renovation cost estimate screening
Value-add ROI direction
- Both Paint exterior walls — Enhances curb appeal and property value. ↑
- Both Clean gutters — Improves drainage and property value. ↑
- Both Install energy-efficient windows — Reduces energy costs and enhances property value. ↑
- Resale Update kitchen appliances — Modernizes the kitchen and attracts buyers. ↑
- Rental Install smart home features — Attracts tech-savvy renters and enhances property value. ↑
ⓘ Cost ranges are severity-bucket heuristics (US national rule-of-thumb). Get contractor quotes + a written scope before underwriting a rehab budget.
Schools (NCES district)
- District
- Waterbury School District
- NCES district ID
- 0904830
- Math proficiency
- 12% ▼ -7.00%
- Reading proficiency
- 23% ▼ -8.00%
- Median HH income
- $40,040
- Composite
- 14.85/100
- National rank
- #9380
- State rank
- #148 of 153 in CT
Livability — Waterbury
- Score
- 79/100
- State rank
- #32
- US rank
- #2205
Category grades
Schools grade is shown separately in the Schools card above.
Census & demographics
- Census place
- Waterbury, CT
- County
- New Haven County · 688,236 people
- City population
- 115,012
- Metro
- New Haven-Milford, CT
- Population (ZIP)
- 2,946
- Household income
- $14,474
- Rent vs Own
- Severe rent burden
- 729.0
Population outlook (Naugatuck Valley County) Hauer SSP2
- By 2040
- 496,846
Race, ethnicity, and origin ACS 2023
- Neighborhood character
- Diverse neighborhood (Simpson 0.68)
- Race & ethnicity
- Black 37% Hispanic / Latino 36% White 24% Two or more races 7%
- Hispanic origin (detail)
- Mexican 2% Puerto Rican 20% Cuban 3% Dominican 9%
- Common ancestry
- Russian 1% Subsaharan African 1% Romanian 1%
- Foreign-born
- 10% · Canada
- Languages at home
- 68% English-only · Spanish 30% Other Indo-European 1%
Political lean MEDSL · Naugatuck Valley
- 2024 margin
- Lean R (+7.4) · D 45.6% · R 53.0% · Other 1.4%
- All cycles
- 2024: R+7.4
Not yet ingested
- Civics
- —
Market trends
- HPI YoY
- —
- Current HPI
- —
- Rent YoY
- —
- Metro
- New Haven-Milford, CT
- State GDP YoY
- ▲ 1.06%
- F500 in state
- 38
Industry mix (Fortune 500 HQ in CT)
| Industry | F500 HQs | Revenue |
|---|---|---|
| Industrial Machinery | 4 | $38B |
|
||
| Insurance | 3 | $71B |
|
||
| Financial Services | 2 | $25B |
|
||
| Transportation / Logistics | 2 | $18B |
|
||
| Healthcare | 1 | $247B |
|
||
| Telecommunications | 1 | $55B |
|
||
Price history
-4.5% since first listed7 events — show timeline
- 2026-05-23 Price Changed $2,625,000 Smart MLS
- 2026-04-21 Listing Removed — Smart MLS
- 2026-04-21 Listed $2,650,000 Smart MLS
- 2026-03-08 Price Changed $2,700,000 Smart MLS
- 2026-03-08 Price Changed $2,750,000 Smart MLS
- 2026-03-07 Price Changed $2,650,000 Smart MLS
- 2026-01-28 Listed $2,750,000 Smart MLS
Cash-flow waterfall
monthlySold comps — $/sqft
last 12 mo · ≤1 miLoading sold comps…