153 Marriott · Graham, TX
Flood risk 1/10 · Minimal
- FEMA flood zone
- X (unshaded)
- Chance of flooding over 30 yrs
- 0.0%
- Est. flood insurance / yr
- $507 – $1,088
Fire risk 8/10 · Major
- Est. fire insurance / yr
- $1,222 – $2,270
Heat risk 7/10 · Major
- Hot days now (above 109°F)
- 7 days/yr
- Hot days in 30 yrs
- 21 days/yr
Wind risk 4/10 · Minor
- Chance of severe wind over 30 yrs
- 17.0%
Air-quality risk 1/10 · Minimal
- Unhealthy air days now
- 0 days/yr
- Unhealthy air days in 30 yrs
- 0 days/yr
Risk factors via First Street. Map © Google.
Why this score? — see what drove the C+ grade
The composite is a weighted blend of 9 inputs, each scored 0–100. Each bar is that input's sub-score; the figure is the points it added to the 100-point composite (weight × sub-score).
- Cash flow +27.4/30.0
- DSCR +9.6/10.0
- ARV discount +7.5/15.0
- 1% rule +6.8/10.0
- Schools +3.9/10.0
- Livability +3.7/5.0
- Rent growth +2.5/5.0
- Condition / age +2.2/5.0
- Appreciation +0.0/10.0
$130,000
🖨 Deal sheet (PDF) 📄 Offer letter ✓ Due diligence
Listing remarks
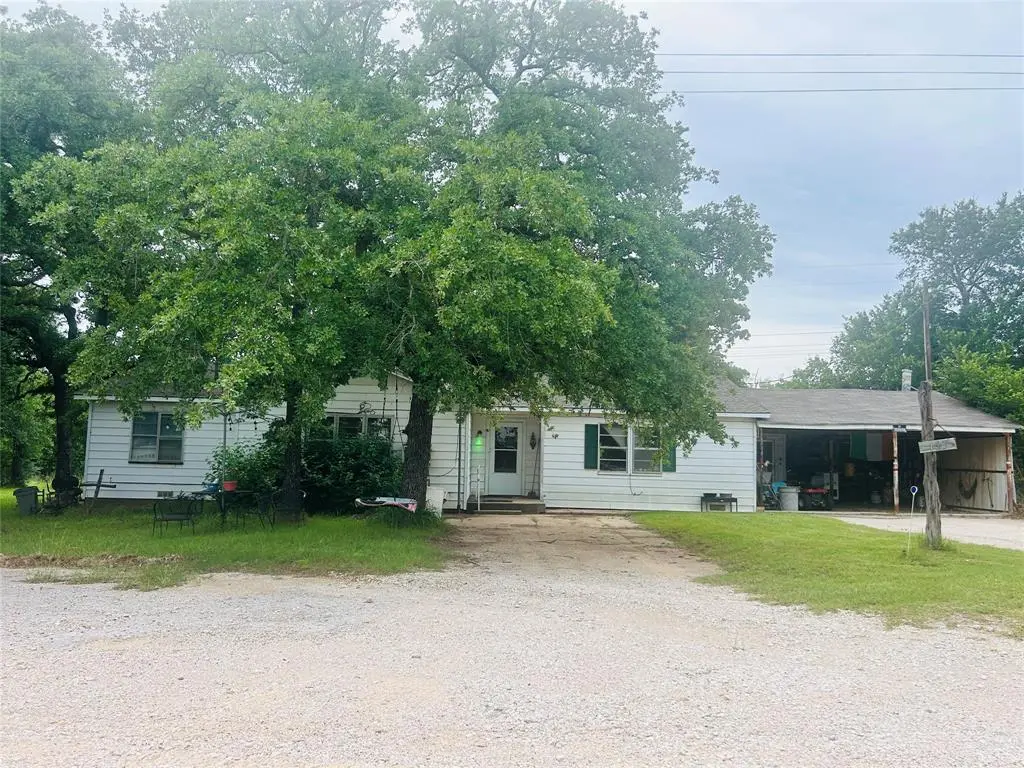
Country living with room to breathe! This 3 bedroom, 2 bath home offers nearly 1,800 square feet of living space and sits on approximately . 75 of an acre outside of city limits with no deed restrictions. The property is filled with beautiful mature trees that give it a peaceful, established feel, plus plenty of space to spread out and enjoy rural living. Major updates include HVAC replaced around 3 years ago and hot water heater installed in last couple years. Home also features a 50 amp RV hookup. Stove and refrigerator will convey with sale. If you've been looking for an affordable property with a little space, privacy and potential, this one is ready for its next owner!
Key facts
- 50 amp rv hookup
- No deed restrictions
- 0.72 acre lot
Tags
Property features AI
Finance
- Other: Directions: Head down Medlan Chappel and turn right; property will be on the left; County: Young; Country: United States
- Financial info: Treat as clear loan type; No second mortgage; Listing accepts cash and conventional offers
- HOA & community: No association
Exterior
- Parking: Covered parking for 2 vehicles; 2-car carport; On-site parking
- Utilities: Aerobic septic system; Not in a municipal utility district
- Home design: Single-family residence; One story; Residential property
- Construction: Built in 1955
- Exterior features: Oak lot features; Approximately 0.72-acre lot
Interior
- Kitchen: Electric oven; Refrigerator
- Bedrooms: 3 bedrooms (primary bedroom on first floor)
- Bathrooms: 1 full bathroom; 1 half bathroom
- Interior features: Eat-in kitchen; One living area; One dining area; Decorative fireplace
Neighborhood map
What this means for you Summary
Snapshot
- This is a 15-bed/10.0-bath single-family listed at $130k. Condition is rated fair.
Deal economics
- At list price, monthly cash flow is $379 ($5k/yr) — positive.
- The deal already cash-flows at list — no discount required.
- Meets the 1% rule at list price ($2k rent vs $130k).
- Recommended offer: $128k (1.5% below list) — sets the bar for market timing.
- Cap rate 9.8% vs local median 2.3% in Graham — top-decile yield for the area; either an underpriced asset or a hidden risk that comps aren't pricing in. Stress-test before assuming the spread holds.
Location & tenants
- Location reads 73/100 on livability (#232 in TX) — a middle-class / working-renter tenant base. Strengths: cost of living A+, housing A+, crime A; Watch: employment C-, health & safety C-, amenities F.
- Graham ISD (town): math 50% / reading 42% proficiency, ranked #252 of 826 in TX (top 30%) — families likely to look elsewhere, expect single-tenant / working-renter base with shorter leases.
- Zoned schools: Graham El (math 47% / reading 44%, grade D-, #1,112 of 4,322 statewide, top 26%, 1,050 students, 64% FRL); Graham J H (math 48% / reading 39%, grade D, #530 of 1,662 statewide, top 32%, 538 students, 61% FRL); Graham H S (math 62% / reading 52%, grade C, #333 of 1,632 statewide, top 22%, 669 students, 51% FRL).
- Market conditions: 188 active listings in the ZIP; 5 units permitted in Young County in 2024 (0 in 5+ unit buildings).
Forward outlook
- Local home prices are declining (-3.0%/yr); year-one equity from $899 of loan paydown is wiped out by about $4k of value loss. Plan a longer hold.
- Young County population projected to shrink 7% by 2050 — rents likely to lag national; underwrite the cash flow, not the appreciation.
- At projected returns (-3.0% appreciation + 3.0% rent growth), your $36k cash investment doubles in ~10 years — after that, you're playing with house money.
Negotiation context
- It's been on market 25 days — a 2% lower offer ($128k) is reasonable based on typical stale-listing flexibility.
Risks & watch-outs
- Watch-outs: built in 1955 — expect roof / HVAC / electrical / plumbing capex.
- Climate carrying-cost: severe wildfire risk; extreme-heat days projected 7→21/yr by 2055 (HVAC capex compounding) — expect insurance premiums to compound above CPI over the hold.
Questions for the listing agent
- Have any recent inspections been done? Can we get a copy of the seller's disclosures and any deferred-maintenance estimates?
- Built in 1955 — when were the roof, HVAC, electrical panel, plumbing, and water heater last replaced?
- Is there a deadline driving the sale (1031 exchange, divorce, estate, relocation)? That informs how much negotiation room exists.
- What's the average days-on-market for RENTAL listings here right now (not sales)? A rising rental-DOM trend means longer vacancies and softer asking-rent achievability than the comps imply.
- What's the recent tenant-quality profile in this submarket — average credit score on applications, eviction rate, late-payment / NSF rate, and stable-employment percentage? A property-management company in the area should have these aggregated.
- How much new for-sale + rental construction is in the pipeline within 1–3 miles? Heavy new supply typically softens prices + rents 12–24 months out; constrained supply supports both.
Investment metrics
- 1% rule
- 1.18% ✓
- Cap rate
- 9.79%
- Cash-on-cash
- 12.50%
- DSCR
- 1.56
- GRM
- 7.1
CMA / ARV
No comps found within radius.
Projected returns pro-forma
-3.0% appreciation · 3.0% rent growth · sell at horizon
- IRR
- 2.2%
- Equity multiple
- 1.08×
- Total profit
- $3,058
- Equity at exit
- $19,383
- IRR
- 11.8%
- Equity multiple
- 1.93×
- Total profit
- $33,676
- Equity at exit
- $11,240
Cash invested: $36,400 (down + closing). Projections, not guarantees.
Landlord ↔ Tenant lean methodology
- Overall (STATE)
- 87 Strongly Landlord-Friendly
- State Texas
- 87 Strongly Landlord-Friendly · R+5
- County
- — inherits STATE
- City
- — inherits STATE
ZIP-level market 76450
- Home prices YoY
- -24.0%
- Active inventory
- 188
- Price-to-rent
- 7.1×
Monthly cashflow live
- Estimated rent
- $1,532 medium interval (Pro) →
- Mortgage (P&I)
- −$682
- Tax from tax record
- −$96 /mo · $1,148/yr
- Insurance
- −$54
- HOA
- −$0
- Vacancy / Maint / Mgmt
- −$322
- Net cashflow
- $379
Break-even live
Sensitivity live
| Price | -10% $453 | -5% $416 | +0% $379 | +5% $342 | +10% $305 |
|---|---|---|---|---|---|
| Rent | -10% $258 | -5% $319 | +0% $379 | +5% $440 | +10% $500 |
| Rate | -1.0pp $445 | -0.5pp $412 | base $379 | +0.5pp $345 | +1.0pp $311 |
UW: 25.0% down · 7.5% · 30yr · 1.5% tax · 5.0% vac · 8.0% maint · 8.0% mgmt
Financing live
Cash to close
- Down payment
- $32,500
- Closing costs
- $3,900
- Reserves months
- —
- Total cash needed
- —
Loan-product check · same deal, 3 products live
Conventional
25% down · 7.5% · 30yr
- Down + closing
- —
- Monthly P&I
- —
- Monthly cashflow
- —
- DSCR
- —
- Eligible?
- —
Personal DTI + credit; lowest rate.
DSCR
20% down · 8.5% · 30yr
- Down + closing
- —
- Monthly P&I
- —
- Monthly cashflow
- —
- DSCR
- —
- Eligible?
- —
No personal income docs; deal must DSCR.
Hard money
10% down · 12.0% · 12mo
- Down + closing
- —
- Monthly P&I
- —
- Monthly cashflow
- —
- DSCR
- —
- Eligible?
- —
Short-term bridge; refi at stabilization.
Listing history 16 events
-
2026-06-21days on market $130,000 Active 25 DOM
-
2026-06-21days on market $130,000 Active 24 DOM
-
2026-06-18days on market $130,000 Active 22 DOM
-
2026-06-17days on market $130,000 Active 21 DOM
-
2026-06-16days on market $130,000 Active 20 DOM
-
2026-06-15days on market $130,000 Active 19 DOM
-
2026-06-13days on market $130,000 Active 17 DOM
-
2026-06-12days on market $130,000 Active 16 DOM
-
2026-06-09days on market $130,000 Active 13 DOM
-
2026-06-08days on market $130,000 Active 12 DOM
-
2026-06-08days on market $130,000 Active 11 DOM
-
2026-06-07days on market $130,000 Active 10 DOM
-
2026-06-03days on market $130,000 Active 7 DOM
-
2026-06-02days on market $130,000 Active 6 DOM
-
2026-06-01days on market $130,000 Active 5 DOM
-
2026-05-31days on market $130,000 Active 4 DOM
ⓘ Source: listings_history table (triggers on properties + properties_extension) + one-shot
backfill from property_details.listing_events for pre-trigger history.
Tax reassessment forecast TX · Resets to sale price
- Current annual tax
- $1,148 · $96/mo
- Projected year-2 tax
- $2,379 · $198/mo
- Expected delta
- +$1,231/yr (+$103/mo · 107.2%)
ⓘ Screening estimate from a state-policy table — verify with the county assessor before closing.
Climate risk First Street
- Flood 1/10 Low FEMA zone X (unshaded) · 0% chance over 30 yrs
- Wildfire 8/10 Severe
- Heat 7/10 Severe 7 d/yr ≥109°F today · 21 d/yr by 30 yrs out
- Wind 4/10 Moderate 17% chance of damaging wind over 30 yrs
- Air quality 1/10 Low 0 unhealthy d/yr today · 0 by 30 yrs out
Nearby sold comps map
Loading sold comps map…
Walkable amenities ~0.75 mi
Loading nearby amenities…
Taxation est. · year 1
- Rental income
- $18,389
- − Mortgage interest
- −$7,282
- − Property taxes
- −$1,148
- − Insurance
- −$650
- − Repairs & maintenance
- −$1,471
- − Management
- −$1,471
- − Depreciation
- −$3,782
- Taxable income
- $2,585
- Est. tax owed @ 24.0%
- −$620
- After-tax cash flow
- $3,928/yr
For passive investors: Depreciation is non-cash, so a rental often shows a tax loss while cash-flowing — sheltering income. Rental losses are passive: they offset passive income freely, and up to $25,000/yr can offset ordinary (W-2) income if you actively participate and your MAGI is under $100k (phasing out to $0 by $150k); unused losses carry forward. On sale, claimed depreciation is recaptured at up to 25%, and gains may owe capital-gains tax (a 1031 exchange can defer both). Figures are a year-1 estimate at your 24.0% rate — not tax advice; consult a CPA.
Condition & rehab AI · 1 photo
This single-family home requires moderate renovations to improve its condition and increase its value. Key areas needing attention include the exterior, roof, flooring, and interior walls.
Repairs flagged
- Major siding — Significant damage
- Major roof — Signs of wear
- Major flooring — Worn and uneven
- Major interior walls — Peeling paint
Value-add opportunities
- Both new siding — Improves curb appeal and durability
- Both new roof — Enhances structural integrity and appearance
- Both new flooring — Boosts comfort and resale value
- Both paint interior walls — Freshens the interior and enhances value
Renovation cost estimate screening
| Repair item | Severity | Est. cost |
|---|---|---|
| siding · Significant damage | Major | $15,000–50,000 |
| roof · Signs of wear | Major | $15,000–50,000 |
| flooring · Worn and uneven | Major | $15,000–50,000 |
| interior walls · Peeling paint | Major | $15,000–50,000 |
| Total estimated repair cost · 4 items | $60,000–200,000 |
Value-add ROI direction
- Both new siding — Improves curb appeal and durability ↑
- Both new roof — Enhances structural integrity and appearance ↑
- Both new flooring — Boosts comfort and resale value ↑
- Both paint interior walls — Freshens the interior and enhances value ↑
ⓘ Cost ranges are severity-bucket heuristics (US national rule-of-thumb). Get contractor quotes + a written scope before underwriting a rehab budget.
Schools (NCES district)
- District
- Graham ISD
- NCES district ID
- 4821360
- Math proficiency
- 50% ▲ 7.00%
- Reading proficiency
- 42% ▲ 2.00%
- Median HH income
- $46,314
- Composite
- 39.16/100
- National rank
- #4030
- State rank
- #252 of 826 in TX
Livability — Graham
- Score
- 73/100
- State rank
- #232
- US rank
- #5580
Category grades
Schools grade is shown separately in the Schools card above.
Census & demographics
- Population (ZIP)
- 12,890
Population outlook (Young County) Hauer SSP2
- Today (2025)
- 17,860 people
- By 2030
- 17,620 · -1.3%
- By 2040
- 17,054 · -4.5%
- By 2050
- 16,551 · -7.3%
- By 2075
- 15,667 · -12.3%
- By 2100
- 14,066 · -21.2%
Race, ethnicity, and origin ACS 2023
- Neighborhood character
- Predominantly White (74%)
- Race & ethnicity
- White 74% Hispanic / Latino 21% Two or more races 10% Black 2%
- Hispanic origin (detail)
- Mexican 16% Puerto Rican 3%
- Common ancestry
- Slovak 3% Italian 2% Serbian 1%
- Foreign-born
- 7% · Canada
- Languages at home
- 84% English-only · Spanish 15%
Political lean MEDSL · Young
- 2024 margin
- Solid R (+76.2) · D 11.6% · R 87.8%
- 2008→2024 swing
- -12.8pp toward R · 2008: -63.5pp · 2024: -76.2pp
- All cycles
- 2024: R+76.2 2020: R+73.8 2016: R+74.6 2012: R+71.5 2008: R+63.5
Not yet ingested
- Civics
- —
Market trends
- HPI YoY
- ▼ -62.82%
- Current HPI
- 198.6373
- Rent YoY
- —
- Metro
- —
- State GDP YoY
- ▲ 3.95%
- F500 in state
- 110
Industry mix (Fortune 500 HQ in TX)
| Industry | F500 HQs | Revenue |
|---|---|---|
| Energy | 16 | $1,198B |
|
||
| Technology | 5 | $198B |
|
||
| Engineering / Construction | 4 | $72B |
|
||
| Energy Services | 3 | $60B |
|
||
| Utilities | 3 | $41B |
|
||
| Healthcare | 2 | $330B |
|
||
Price history
3 events — show timeline
- 2026-05-27 Listed $130,000 NTREIS
- 2026-02-02 Sold (Public Records) — Public Records
- 2001-11-19 Sold (Public Records) — Public Records
Property tax history
+20.5%/yrLatest (2025): $1,148 · +20.5% YoY. Source: county tax records.
Cash-flow waterfall
monthlySold comps — $/sqft
last 12 mo · ≤1 miLoading sold comps…