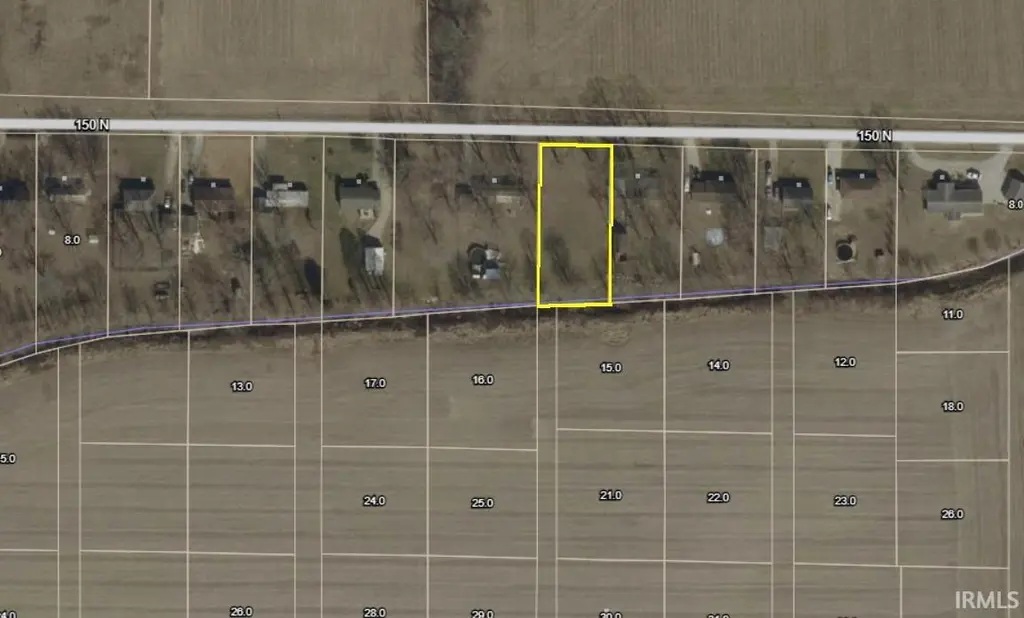
150 N Lot · Hatfield, IN
Flood risk 1/10 · Minimal
- FEMA flood zone
- X (unshaded)
- Chance of flooding over 30 yrs
- 0.0%
- Est. flood insurance / yr
- $507 – $1,088
Fire risk 1/10 · Minimal
- Est. fire insurance / yr
- $717 – $1,331
Heat risk 5/10 · Moderate
- Hot days now (above 107°F)
- 7 days/yr
- Hot days in 30 yrs
- 19 days/yr
Wind risk 3/10 · Minor
- Chance of severe wind over 30 yrs
- 5.0%
Air-quality risk 2/10 · Minimal
- Unhealthy air days now
- 2 days/yr
- Unhealthy air days in 30 yrs
- 2 days/yr
Risk factors via First Street. Map © Google.
Why this score? — see what drove the F grade
The composite is a weighted blend of 9 inputs, each scored 0–100. Each bar is that input's sub-score; the figure is the points it added to the 100-point composite (weight × sub-score).
- Cash flow +8.8/30.0
- Appreciation +6.2/10.0
- Schools +4.2/10.0
- Livability +3.2/5.0
- 1% rule +2.7/10.0
- Rent growth +2.5/5.0
- DSCR +2.4/10.0
- Condition / age +1.0/5.0
- ARV discount +0.0/15.0
$165,000
🖨 Deal sheet (PDF) 📄 Offer letter ✓ Due diligence
Key facts
- 0.54 acre lot
- Built 2026
Neighborhood map
What this means for you Summary
Snapshot
- This is a 3-bed/2.0-bath single-family listed at $165k. Condition is rated poor.
Deal economics
- At list price, monthly cash flow is $-136 ($-2k/yr) — negative.
- To cash-flow at today's rent, offer at most $145k (11.9% below list).
- To meet the 1% rule (rent ≥ 1% of price), the offer needs to be $127k (22.9% below list).
- Recommended offer: $127k (22.9% below list) — sets the bar for 1% rule.
Location & tenants
- Location reads 63/100 on livability (#438 in IN) — a middle-class / working-renter tenant base. Strengths: cost of living A+, housing A+, employment A; Watch: crime C-, amenities F, commute F.
- South Spencer County School Corporation (rural): math 46% / reading 54% proficiency, ranked #58 of 301 in IN (top 19%) — acceptable for families but not a draw, mixed tenant base, ~2y average lease.
- Zoned schools: Luce Elementary School (math 57% / reading 47%, grade C-, #237 of 994 statewide, top 26%, 189 students, 38% FRL); South Spencer Middle School (math 39% / reading 52%, grade D+, #79 of 330 statewide, top 24%, 228 students, 56% FRL); South Spencer High School (math 47% / reading 67%, grade C, #64 of 369 statewide, top 18%, 357 students, 44% FRL).
- Market conditions: 42 active listings in the ZIP; 78 units permitted in Spencer County in 2024 (0 in 5+ unit buildings).
Forward outlook
- In year one you build about $5k of equity ($1k loan paydown + $4k appreciation (2.3% local appreciation)).
- Spencer County population projected at -16% by 2050 — secular population decline; favor cash flow + early exit over multi-decade hold.
- By year 7, paydown + projected appreciation supports a ~$32k cash-out refi (75% LTV) — recoverable capital for the next deal without selling this one.
Negotiation context
- Only 1 days on market — expect competitive offers; lowballing is unlikely to land.
Risks & watch-outs
- Climate carrying-cost: extreme-heat days projected 7→19/yr by 2055 (HVAC capex compounding) — expect insurance premiums to compound above CPI over the hold.
Questions for the listing agent
- What do current leases actually rent for vs. the listed asking? Can we see a recent rent roll and the last 12 months of T-12 income?
- Have any recent inspections been done? Can we get a copy of the seller's disclosures and any deferred-maintenance estimates?
- Is there a deadline driving the sale (1031 exchange, divorce, estate, relocation)? That informs how much negotiation room exists.
- Schools are F-rated, which usually means shorter tenancies and higher turnover. Who's the typical renter profile here, and what's been the actual vacancy rate?
- The area grade is low — what's the realistic commute time and amenity access for the typical tenant pool here? Any planned neighborhood developments (good or bad) we should know about?
- What's the average days-on-market for RENTAL listings here right now (not sales)? A rising rental-DOM trend means longer vacancies and softer asking-rent achievability than the comps imply.
- What's the recent tenant-quality profile in this submarket — average credit score on applications, eviction rate, late-payment / NSF rate, and stable-employment percentage? A property-management company in the area should have these aggregated.
- How much new for-sale + rental construction is in the pipeline within 1–3 miles? Heavy new supply typically softens prices + rents 12–24 months out; constrained supply supports both.
Investment metrics
- 1% rule
- 0.77% ✗
- Cap rate
- 5.30%
- Cash-on-cash
- -3.53%
- DSCR
- 0.84
- GRM
- 10.8
CMA / ARV
- ARV (on-the-fly)
- $126,360
- Comps found
- 5
Show comp detail 5 sales within ~0.75 mi
| Address | Dist | Beds/Ba | Sqft | Sold | Price | $/sf | Match |
|---|---|---|---|---|---|---|---|
| 1256 N County Road 850 | 0.35mi | 2/1.0 (-1) | 1,008 (-7%) | 2mo | $165,000 | $164 | 62 |
| 1237 N Johnson St | 0.36mi | 3/1.0 | 946 (-12%) | 2mo | $105,000 | $111 | 57 |
| 1124 N Maple St | 0.36mi | 2/1.0 (-1) | 1,008 (-7%) | 10mo | $150,500 | $149 | 54 |
| 1152 N Cherry St | 0.34mi | 3/1.0 | 960 (-11%) | 20mo | $68,000 | $71 | 45 |
| 1148 N County Road 900 W | 0.40mi | 2/2.0 (-1) | 1,216 (+13%) | 12mo | $142,000 | $117 | 45 |
Match score weights: distance 35% · size 25% · config 20% · recency 20%. Top-matched comps best support the ARV.
Projected returns pro-forma
2.31% appreciation · 3.0% rent growth · sell at horizon
- IRR
- 2.1%
- Equity multiple
- 1.11×
- Total profit
- $5,297
- Equity at exit
- $67,868
- IRR
- 5.9%
- Equity multiple
- 1.84×
- Total profit
- $38,645
- Equity at exit
- $99,918
Cash invested: $46,200 (down + closing). Projections, not guarantees.
Landlord ↔ Tenant lean methodology
- Overall (STATE)
- 90 Strongly Landlord-Friendly
- State Indiana
- 90 Strongly Landlord-Friendly · R+11
- County
- — inherits STATE
- City
- — inherits STATE
ZIP-level market 47634
- Home prices YoY
- 1.1%
- Active inventory
- 42
- Price-to-rent
- 10.8×
Monthly cashflow live
- Estimated rent
- $1,271 medium interval (Pro) →
- Mortgage (P&I)
- −$865
- Tax est. 1.5%
- −$206 /mo · $2,475/yr
- Insurance
- −$69
- HOA
- −$0
- Vacancy / Maint / Mgmt
- −$267
- Net cashflow
- $-136
Break-even live
Sensitivity live
| Price | -10% $-22 | -5% $-79 | +0% $-136 | +5% $-193 | +10% $-250 |
|---|---|---|---|---|---|
| Rent | -10% $-236 | -5% $-186 | +0% $-136 | +5% $-86 | +10% $-35 |
| Rate | -1.0pp $-53 | -0.5pp $-94 | base $-136 | +0.5pp $-179 | +1.0pp $-222 |
UW: 25.0% down · 7.5% · 30yr · 1.5% tax · 5.0% vac · 8.0% maint · 8.0% mgmt
Financing live
Cash to close
- Down payment
- $41,250
- Closing costs
- $4,950
- Reserves months
- —
- Total cash needed
- —
Loan-product check · same deal, 3 products live
Conventional
25% down · 7.5% · 30yr
- Down + closing
- —
- Monthly P&I
- —
- Monthly cashflow
- —
- DSCR
- —
- Eligible?
- —
Personal DTI + credit; lowest rate.
DSCR
20% down · 8.5% · 30yr
- Down + closing
- —
- Monthly P&I
- —
- Monthly cashflow
- —
- DSCR
- —
- Eligible?
- —
No personal income docs; deal must DSCR.
Hard money
10% down · 12.0% · 12mo
- Down + closing
- —
- Monthly P&I
- —
- Monthly cashflow
- —
- DSCR
- —
- Eligible?
- —
Short-term bridge; refi at stabilization.
Listing history 2 events
-
2026-04-12status Pending
-
2026-04-12$165,000 Active
ⓘ Source: listings_history table (triggers on properties + properties_extension) + one-shot
backfill from property_details.listing_events for pre-trigger history.
Climate risk First Street
- Flood 1/10 Low FEMA zone X (unshaded) · 0% chance over 30 yrs
- Wildfire 1/10 Low
- Heat 5/10 Major 7 d/yr ≥107°F today · 19 d/yr by 30 yrs out
- Wind 3/10 Moderate 5% chance of damaging wind over 30 yrs
- Air quality 2/10 Low 2 unhealthy d/yr today · 2 by 30 yrs out
Nearby sold comps map
Loading sold comps map…
Walkable amenities ~0.75 mi
Loading nearby amenities…
Taxation est. · year 1
- Rental income
- $15,257
- − Mortgage interest
- −$9,243
- − Property taxes
- −$2,475
- − Insurance
- −$825
- − Repairs & maintenance
- −$1,221
- − Management
- −$1,221
- − Depreciation
- −$4,800
- Taxable loss
- −$4,527
- Est. tax savings @ 24.0%
- +$1,086
- After-tax cash flow
- $-544/yr
For passive investors: Depreciation is non-cash, so a rental often shows a tax loss while cash-flowing — sheltering income. Rental losses are passive: they offset passive income freely, and up to $25,000/yr can offset ordinary (W-2) income if you actively participate and your MAGI is under $100k (phasing out to $0 by $150k); unused losses carry forward. On sale, claimed depreciation is recaptured at up to 25%, and gains may owe capital-gains tax (a 1031 exchange can defer both). Figures are a year-1 estimate at your 24.0% rate — not tax advice; consult a CPA.
Condition & rehab AI · 2 photos
The property requires extensive repairs and updates to its roof, exterior, interior, HVAC, and landscaping, significantly impacting its current condition and value.
Repairs flagged
- Major roof — No visible roof in the satellite image, suggesting potential structural issues.
- Major exterior — No visible exterior in the satellite image, suggesting potential siding and structural issues.
- Major interior walls/paint — No visible interior walls or paint in the satellite image, suggesting potential drywall and painting issues.
- Major HVAC/mechanicals — No visible HVAC or mechanicals in the satellite image, suggesting potential heating and cooling issues.
- Major landscaping/curb appeal — No visible landscaping or curb appeal in the satellite image, suggesting potential landscaping and curb appeal issues.
Value-add opportunities
- Both roof replacement — A new roof would significantly improve the home's appearance and functionality.
- Both exterior siding and paint — New siding and paint would enhance the home's curb appeal and value.
- Both HVAC system upgrade — A new HVAC system would improve comfort and energy efficiency.
- Both landscaping and curb appeal — A well-maintained landscape would enhance the home's curb appeal and value.
- Both interior updates — Painting and updating interior spaces would improve the home's livability and value.
Renovation cost estimate screening
| Repair item | Severity | Est. cost |
|---|---|---|
| roof · No visible roof in the satellite image, suggesting potential structural issues. | Major | $15,000–50,000 |
| exterior · No visible exterior in the satellite image, suggesting potential siding and structural issues. | Major | $15,000–50,000 |
| interior walls/paint · No visible interior walls or paint in the satellite image, suggesting potential drywall and painting issues. | Major | $15,000–50,000 |
| HVAC/mechanicals · No visible HVAC or mechanicals in the satellite image, suggesting potential heating and cooling issues. | Major | $15,000–50,000 |
| landscaping/curb appeal · No visible landscaping or curb appeal in the satellite image, suggesting potential landscaping and curb appeal issues. | Major | $15,000–50,000 |
| Total estimated repair cost · 5 items | $75,000–250,000 |
Value-add ROI direction
- Both roof replacement — A new roof would significantly improve the home's appearance and functionality. ↑
- Both exterior siding and paint — New siding and paint would enhance the home's curb appeal and value. ↑
- Both HVAC system upgrade — A new HVAC system would improve comfort and energy efficiency. ↑
- Both landscaping and curb appeal — A well-maintained landscape would enhance the home's curb appeal and value. ↑
- Both interior updates — Painting and updating interior spaces would improve the home's livability and value. ↑
ⓘ Cost ranges are severity-bucket heuristics (US national rule-of-thumb). Get contractor quotes + a written scope before underwriting a rehab budget.
Schools (NCES district)
- District
- South Spencer County School Corporation
- NCES district ID
- 1810560
- Math proficiency
- 46% ▼ -6.00%
- Reading proficiency
- 54% ▼ -2.00%
- Median HH income
- $47,220
- Composite
- 42.49/100
- National rank
- #3208
- State rank
- #58 of 301 in IN
Livability — Hatfield
- Score
- 63/100
- State rank
- #438
- US rank
- #15721
Category grades
Schools grade is shown separately in the Schools card above.
Census & demographics
- Census place
- Hatfield, IN
- Population (ZIP)
- 2,101
Population outlook (Spencer County) Hauer SSP2
- Today (2025)
- 20,394 people
- By 2030
- 19,912 · -2.4%
- By 2040
- 18,592 · -8.8%
- By 2050
- 17,051 · -16.4%
- By 2075
- 14,010 · -31.3%
- By 2100
- 10,869 · -46.7%
Race, ethnicity, and origin ACS 2023
- Neighborhood character
- Predominantly White (94%)
- Race & ethnicity
- White 94% Two or more races 6% Hispanic / Latino 3%
- Common ancestry
- Lithuanian 4% Romanian 2% English 2%
- Foreign-born
- 3% · Canada
- Languages at home
- 97% English-only · French/Haitian/Cajun 1% Spanish 1%
Political lean MEDSL · Spencer
- 2024 margin
- Solid R (+43.3) · D 27.4% · R 70.6% · Other 2.0%
- 2008→2024 swing
- -43.6pp toward R · 2008: 0.4pp · 2024: -43.3pp
- All cycles
- 2024: R+43.3 2020: R+38.5 2016: R+37.3 2012: R+15.3 2008: D+0.4
Not yet ingested
- Civics
- —
Market trends
- HPI YoY
- ▲ 2.31%
- Current HPI
- 210.8511
- Rent YoY
- —
- Metro
- —
- State GDP YoY
- ▲ 2.90%
- F500 in state
- 18
Industry mix (Fortune 500 HQ in IN)
| Industry | F500 HQs | Revenue |
|---|---|---|
| Industrial Machinery | 2 | $37B |
|
||
| Healthcare | 1 | $177B |
|
||
| Pharmaceuticals | 1 | $45B |
|
||
| Metals / Steel | 1 | $18B |
|
||
| Agriculture | 1 | $17B |
|
||
| Packaging | 1 | $12B |
|
||
Price history
2 events — show timeline
- 2026-04-12 Pending — IRMLS
- 2026-04-12 Listed $165,000 IRMLS
Cash-flow waterfall
monthlySold comps — $/sqft
last 12 mo · ≤1 miLoading sold comps…