8531 Mississippi 481 · Polkville, MS
Flood risk 1/10 · Minimal
- FEMA flood zone
- X (unshaded)
- Chance of flooding over 30 yrs
- 0.0%
- Est. flood insurance / yr
- $507 – $1,088
Fire risk 4/10 · Minor
- Est. fire insurance / yr
- $1,241 – $2,305
Heat risk 7/10 · Major
- Hot days now (above 107°F)
- 7 days/yr
- Hot days in 30 yrs
- 21 days/yr
Wind risk 8/10 · Major
- Chance of severe wind over 30 yrs
- 80.0%
Air-quality risk 1/10 · Minimal
- Unhealthy air days now
- 0 days/yr
- Unhealthy air days in 30 yrs
- 0 days/yr
Risk factors via First Street. Map © Google.
Why this score? — see what drove the B grade
The composite is a weighted blend of 9 inputs, each scored 0–100. Each bar is that input's sub-score; the figure is the points it added to the 100-point composite (weight × sub-score).
- Cash flow +30.0/30.0
- 1% rule +10.0/10.0
- DSCR +10.0/10.0
- ARV discount +7.5/15.0
- Appreciation +6.6/10.0
- Schools +2.9/10.0
- Livability +2.9/5.0
- Rent growth +2.5/5.0
- Condition / age +2.5/5.0
$65,000
🖨 Deal sheet 📄 Offer letter ✓ Due diligence
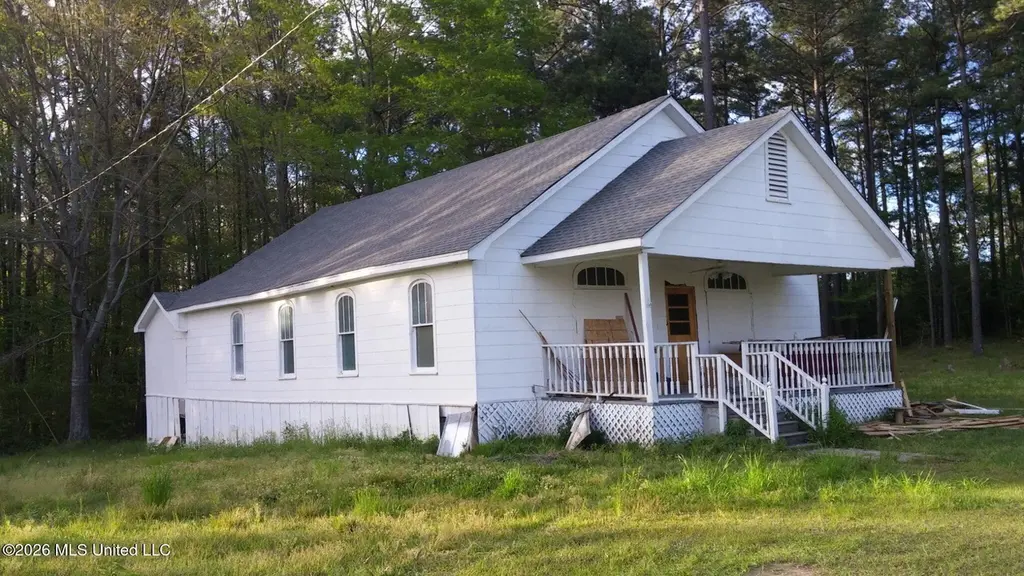
Listing remarks
Looking for the perfect hunting retreat, weekend getaway, or investment property? This fixer upper sits on beautiful land directly next to National Forest property, giving you immediate access to lots of acres of hunting and recreation right from your backyard. Whether you're looking to renovate, build your dream cabin, or create the ultimate hunting camp, this property is a rare opportunity for outdoor enthusiasts. Property Features: * Boarders National Forest land * Excellent deer, turkey, and wildlife hunting area * Private, peaceful setting * Ideal for hunting camp, cabin retreat, or homestead Bring your vision and turn this hidden gem into something special. Properties with dire
Key facts
- 2.14 acre lot
- Listed 6 days
Tags
Property features AI
Finance
- Other: Pets allowed; Lot size about 2.14 acres
Exterior
- Parking: Driveway (gravel)
- Utilities: Septic tank; Community water; Cable available; Electricity connected; Sewer connected; Water connected
- Home design: One-story; Move-in ready; Other property type; Entry faces unspecified
- Construction: Wood siding; Conventional foundation; Asphalt roof; Built area approximately 2,421 (public records)
- Exterior features: Front porch; Front yard; Wooded lot
Interior
- Kitchen: Oven
- Flooring: Combination flooring
- Bathrooms: 2 full bathrooms
- Heating & cooling: Central heating; Central air conditioning
- Interior features: Open floorplan; Wood-framed windows
Neighborhood map
What this means for you Summary
Snapshot
- This is a 3-bed/1.0-bath other listed at $65k.
Deal economics
- At list price, monthly cash flow is $443 ($5k/yr) — positive.
- The deal already cash-flows at list — no discount required.
- Meets the 1% rule at list price ($1k rent vs $65k).
Location & tenants
- Location reads 58/100 on livability (#269 in MS) — a working-class tenant base; expect higher turnover. Strengths: cost of living A+, housing A+, crime B+; Watch: amenities F, commute F, employment F.
- Smith County School District (rural): math 35% / reading 35% proficiency, ranked #55 of 130 in MS (top 42%) — families likely to look elsewhere, expect single-tenant / working-renter base with shorter leases.
- Zoned schools: Raleigh Elementary School (math 23% / reading 39%, grade F, #185 of 375 statewide, top 49%, 587 students, 100% FRL); Raleigh High School (math 47% / reading 35%, grade F, #49 of 197 statewide, top 25%, 442 students, 99% FRL) — zoned schools average 99% FRL vs 58% district-wide (42 pts higher); higher-poverty schools than district average — tighter screening recommended.
- Market conditions: 9 active listings in the ZIP.
Forward outlook
- In year one you build about $2k of equity ($449 loan paydown + $2k appreciation (3.1% local appreciation)).
- Smith County population projected at -20% by 2050 — secular population decline; favor cash flow + early exit over multi-decade hold.
- At projected returns (3.1% appreciation + 3.0% rent growth), your $18k cash investment doubles in ~3 years — after that, you're playing with house money.
Negotiation context
- Only 6 days on market — expect competitive offers; lowballing is unlikely to land.
Risks & watch-outs
- Climate carrying-cost: severe wind risk, 80% chance of damaging wind over 30y; extreme-heat days projected 7→21/yr by 2055 (HVAC capex compounding) — expect insurance premiums to compound above CPI over the hold.
Questions for the listing agent
- Is there a deadline driving the sale (1031 exchange, divorce, estate, relocation)? That informs how much negotiation room exists.
- Schools are F-rated, which usually means shorter tenancies and higher turnover. Who's the typical renter profile here, and what's been the actual vacancy rate?
- What's the average days-on-market for RENTAL listings here right now (not sales)? A rising rental-DOM trend means longer vacancies and softer asking-rent achievability than the comps imply.
- What's the recent tenant-quality profile in this submarket — average credit score on applications, eviction rate, late-payment / NSF rate, and stable-employment percentage? A property-management company in the area should have these aggregated.
- How much new for-sale + rental construction is in the pipeline within 1–3 miles? Heavy new supply typically softens prices + rents 12–24 months out; constrained supply supports both.
Investment metrics
- 1% rule
- 1.83% ✓
- Cap rate
- 14.46%
- Cash-on-cash
- 29.19%
- DSCR
- 2.30
- GRM
- 4.6
CMA / ARV
No comps found within radius.
Projected returns pro-forma
3.14% appreciation · 3.0% rent growth · sell at horizon
- IRR
- 35.3%
- Equity multiple
- 3.01×
- Total profit
- $36,550
- Equity at exit
- $29,738
- IRR
- 35.4%
- Equity multiple
- 5.95×
- Total profit
- $90,087
- Equity at exit
- $46,231
Cash invested: $18,200 (down + closing). Projections, not guarantees.
Landlord ↔ Tenant lean methodology
- Overall (STATE)
- 90 Strongly Landlord-Friendly
- State Mississippi
- 90 Strongly Landlord-Friendly · R+11
- County
- — inherits STATE
- City
- — inherits STATE
ZIP-level market 39152
- Home prices YoY
- 3.6%
- Active inventory
- 9
- Price-to-rent
- 4.6×
Monthly cashflow live
- Estimated rent
- $1,189 medium interval (Pro) →
- Mortgage (P&I)
- −$341
- Tax from tax record
- −$129 /mo · $1,545/yr
- Insurance
- −$27
- HOA
- −$0
- Vacancy / Maint / Mgmt
- −$250
- Net cashflow
- $443
Break-even live
UW: 25.0% down · 7.5% · 30yr · 1.5% tax · 5.0% vac · 8.0% maint · 8.0% mgmt
Financing live
Cash to close
- Down payment
- $16,250
- Closing costs
- $1,950
- Reserves months
- —
- Total cash needed
- —
Loan-product check · same deal, 3 products live
Conventional
25% down · 7.5% · 30yr
- Down + closing
- —
- Monthly P&I
- —
- Monthly cashflow
- —
- DSCR
- —
- Eligible?
- —
Personal DTI + credit; lowest rate.
DSCR
20% down · 8.5% · 30yr
- Down + closing
- —
- Monthly P&I
- —
- Monthly cashflow
- —
- DSCR
- —
- Eligible?
- —
No personal income docs; deal must DSCR.
Hard money
10% down · 12.0% · 12mo
- Down + closing
- —
- Monthly P&I
- —
- Monthly cashflow
- —
- DSCR
- —
- Eligible?
- —
Short-term bridge; refi at stabilization.
Listing history 1 events
-
2026-05-19$65,000 Active
ⓘ Source: listings_history table (triggers on properties + properties_extension) + one-shot
backfill from property_details.listing_events for pre-trigger history.
Tax reassessment forecast MS · Resets to sale price
- Current annual tax
- $1,545 · $129/mo
- Projected year-2 tax
- $1,545 · $129/mo
- Expected delta
- $0/yr ($0/mo · 0.0%)
ⓘ Screening estimate from a state-policy table — verify with the county assessor before closing.
Climate risk First Street
- Flood 1/10 Low FEMA zone X (unshaded) · 0% chance over 30 yrs
- Wildfire 4/10 Moderate
- Heat 7/10 Severe 7 d/yr ≥107°F today · 21 d/yr by 30 yrs out
- Wind 8/10 Severe 80% chance of damaging wind over 30 yrs
- Air quality 1/10 Low 0 unhealthy d/yr today · 0 by 30 yrs out
Nearby sold comps map
Loading sold comps map…
Walkable amenities ~0.75 mi
Loading nearby amenities…
Taxation est. · year 1
- Rental income
- $14,268
- − Mortgage interest
- −$3,641
- − Property taxes
- −$1,545
- − Insurance
- −$325
- − Repairs & maintenance
- −$1,141
- − Management
- −$1,141
- − Depreciation
- −$1,891
- Taxable income
- $4,584
- Est. tax owed @ 24.0%
- −$1,100
- After-tax cash flow
- $4,212/yr
For passive investors: Depreciation is non-cash, so a rental often shows a tax loss while cash-flowing — sheltering income. Rental losses are passive: they offset passive income freely, and up to $25,000/yr can offset ordinary (W-2) income if you actively participate and your MAGI is under $100k (phasing out to $0 by $150k); unused losses carry forward. On sale, claimed depreciation is recaptured at up to 25%, and gains may owe capital-gains tax (a 1031 exchange can defer both). Figures are a year-1 estimate at your 24.0% rate — not tax advice; consult a CPA.
Schools (NCES district)
- District
- Smith County School District
- NCES district ID
- 2804020
- Math proficiency
- 35% ▼ -12.00%
- Reading proficiency
- 35% ▼ -8.00%
- Median HH income
- $36,791
- Composite
- 29.09/100
- National rank
- #6597
- State rank
- #55 of 130 in MS
Livability — Polkville
- Score
- 58/100
- State rank
- #269
- US rank
- #21209
Category grades
Schools grade is shown separately in the Schools card above.
Census & demographics
- Population (ZIP)
- 714
Population outlook (Smith County) Hauer SSP2
- Today (2025)
- 15,231 people
- By 2030
- 14,658 · -3.8%
- By 2040
- 13,448 · -11.7%
- By 2050
- 12,234 · -19.7%
- By 2075
- 9,527 · -37.4%
- By 2100
- 7,537 · -50.5%
Race, ethnicity, and origin ACS 2023
- Neighborhood character
- Predominantly White (91%)
- Race & ethnicity
- White 91% Black 9%
- Common ancestry
- Lithuanian 7% Slovak 3%
Political lean MEDSL · Smith
- 2024 margin
- Solid R (+60.7) · D 19.4% · R 80.1%
- 2008→2024 swing
- -9.0pp toward R · 2008: -51.7pp · 2024: -60.7pp
- All cycles
- 2024: R+60.7 2020: R+56.0 2016: R+56.6 2012: R+50.2 2008: R+51.7
Not yet ingested
- Civics
- —
Market trends
- HPI YoY
- ▲ 3.14%
- Current HPI
- 90.1651
- Rent YoY
- —
- Metro
- —
- State GDP YoY
- —
- F500 in state
- 0
Price history
1 event — show timeline
- 2026-05-19 Listed $65,000 MLSU
Property tax history
+35.4%/yrLatest (2025): $1,545 · +24.9% YoY. Source: county tax records.
Cash-flow waterfall
monthlySold comps — $/sqft
last 12 mo · ≤1 miLoading sold comps…